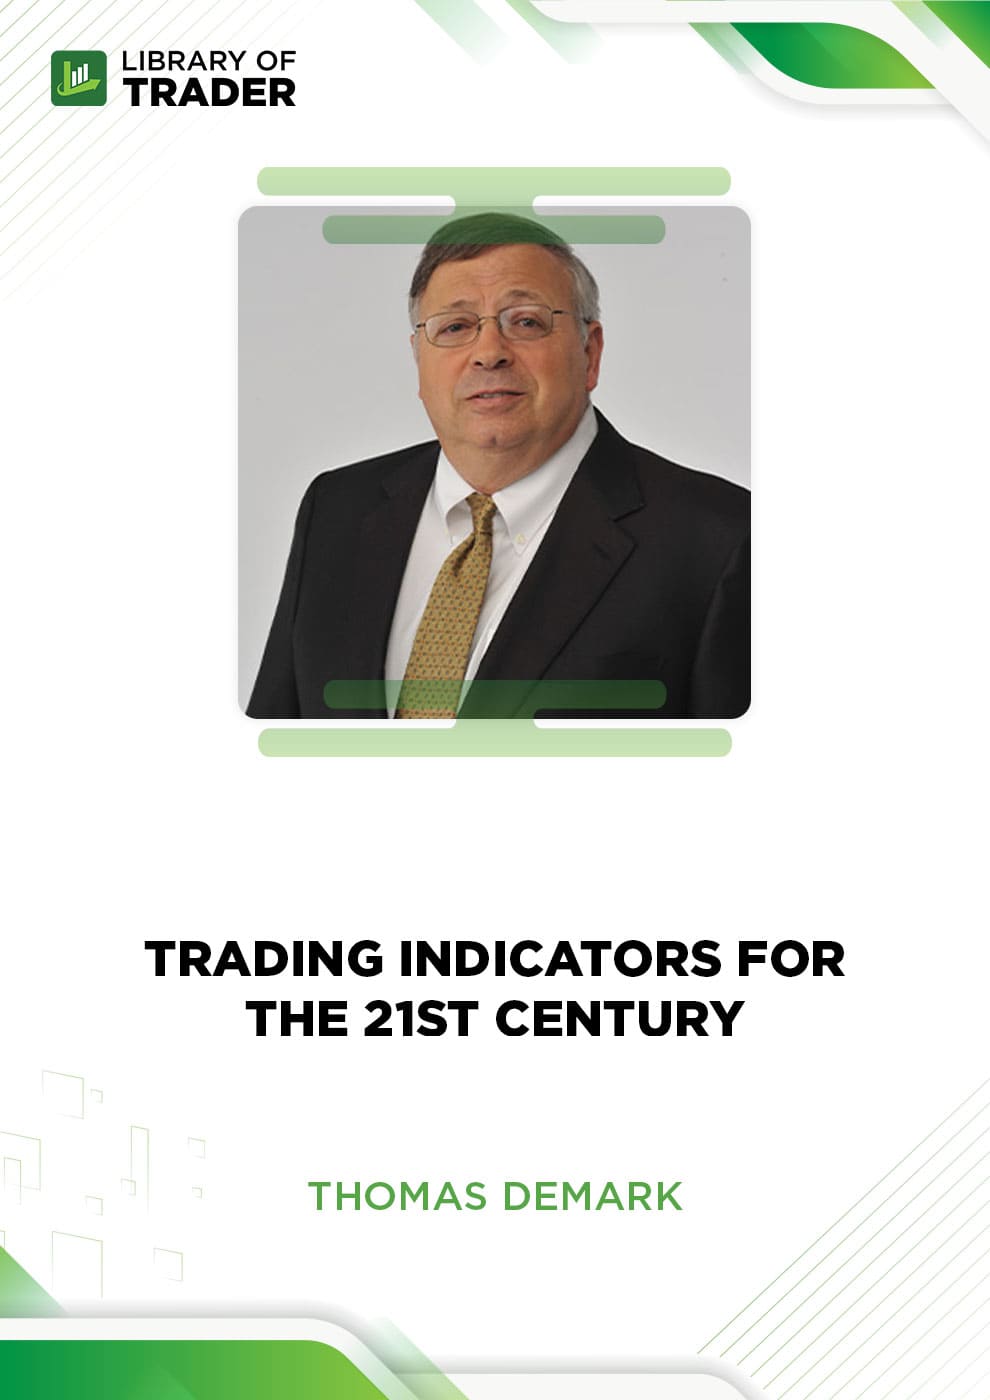
Trading Indicators for the 21st Century by Thomas Demark sheds light on powerful tools that enable traders to smooth the trading process and win more profits no matter how volatile the market is.
Course Overview
Trading Indicators for the 21st Century by Thomas Demark presents top proprietary technical indicators with detailed instructions and illustrated case studies. You can learn how to use these tools to draw insights into market trend patterns.
Course Outline
- Volume 1: Trading Exaggerated Market Moves
- Identifying low-risk entry zones in virtually any market
- How to pinpoint potential trend reversals when a low-risk buy or sell zone has been identified
- Using Tom’s indicators to locate potential trend reversals
- Combining Tom’s indicators with additional filters to improve your market timing
- Volume 2: Identifying Market Turns Before the Crowd
- Identifying tops and bottoms before other traders spot them
- Applying the two phases of Sequential to price charts
- Determining if a low-risk buy or sell zone might be successful or if the previous trend will continue
- Where to ‘draw the line’ and when to disqualify a previously identified low-risk buy or sell zone before a trade confirmation occurs
- Volume 3: Anticipating Trend Changes for Big Profits
- How to anticipate potential trend changes more quickly
- Identifying price exhaustion zones using TD Combo
- How to use TD Combo with TD Sequential to identify low-risk buy and sell zones
- An introduction to TDST, Tom’s most significant contribution to market timing
- Defining trend reversals and support and resistance zones
- Using TDST to determine whether or not the Countdown phase of TD Sequential or TD Combo will go to completion
- Volume 4: Projecting Tops and Bottoms
- Calculating and applying TD Trend Factor to price charts
- Using TD Trend Factor to predict high probability upside and downside objectives
- Projecting retracements and tops or bottoms using TD Trend Factor
- Applying Relative Retracement to recent price advances or declines to determine where short- and/or long-term support and resistance levels may occur
- How to use Absolute Retracement to calculate sup- port levels for markets that are trading at all-time highs
- Volume 5: Thomas Demark – Trading Indicators
- Using trendline breakouts to create consistent indicators
- How to identify false breakouts and price exhaustion zones with more precision
- Identifying and constructing TD Lines and using them to confirm low-risk buy or sell zones
- Combining TD Diff with TD Open to confirm the identification of TD Sequential and TD Combo low-risk buy and sell zones
- Volume 6: Determining the Duration of Market Moves
- Using Tom’s indicators to deter- mine the duration of market moves
- How to use a simple moving average technique to confirm a trend change when a low-risk buy or sell zone has been identified
- Using TD Channels to alert you to a possible change in the direction of a trend – and how to take advantage of the opportunity when it occurs
- How to construct your own oscillator using an oscillator ‘shell’
- Identifying potential price break- outs using a price compression approach
What Will You Learn?
- Coherent instructions on trading indicators and tools.
- Viable strategies and techniques based on valuable insights from technical analysis and tools.
- Illustrated case studies and examples.
Who Is This Course For?
The course is great for any trader who wants to learn technical analysis and look for powerful tools.
Thomas R. DeMark
Please Login/Register if you want to leave us some feedback to help us improve our services and products.
RELATED COURSES
VIEW ALL-
 Swing and Price Analysis (May 2014) – Profile TradersDOWNLOADSwing and Price Analysis (May 2014) – Profile TradersUpdate 08 Dec 2022All LevelsDOWNLOAD
The Swing and Price Analysis (May 2014) by Profile Traders deep dives into pivot point, swing, and trend patterns. As a result, you can easily see the patterns of market movements. Such insights enhance the accuracy of price action forecasting, thus you do not panic of sudden reversals or price actions.
Add to wishlist -
 Introduction to Position Sizing Strategies – Van Tharp InstituteDOWNLOADIntroduction to Position Sizing Strategies – Van Tharp InstituteUpdate 02 Nov 2022DOWNLOAD
If you are having difficulty assessing and minimizing your trading risks, then you want a practical method to understand risk and learn how to reduce losses. This Introduction to Position Sizing Strategies course by Van Tharp Institute is unquestionably for you
Add to wishlist -
 Trading Indicators for the 21st Century – Thomas DemarkDOWNLOADTrading Indicators for the 21st Century – Thomas DemarkUpdate 15 Nov 2022All LevelsDOWNLOAD
Trading Indicators for the 21st Century by Thomas Demark sheds light on powerful tools that enable traders to smooth the trading process and win more profits no matter how volatile the market is.
Add to wishlist -
 Mostafa Belkhayate Trading SystemDOWNLOADMostafa Belkhayate Trading SystemUpdate 04 Nov 2022All LevelsDOWNLOAD
Mostafa Belkhayate Trading System completes the power of many custom-made indicators for technical analyzing the movements of the forex market.
Add to wishlist -
 The Basics of the Wave Principle – Elliott Wave InternationalDOWNLOADThe Basics of the Wave Principle – Elliott Wave InternationalUpdate 01 Dec 2022BeginnerDOWNLOAD
The Basics of the Wave Principle by Elliott Wave International provides you with the fundamentals of Wave principles to accurately forecast price actions. Thus, you will no longer panic about market trends but have viable strategies to deal with tough sudden market moves.
Add to wishlist -
 Candlecharts Academy – Swing Trading 1DOWNLOADCandlecharts Academy – Swing Trading 1Update 06 Nov 2022All LevelsDOWNLOAD
With the Candle Charts Academy – Swing Trading 1, you will learn how to locate and trade both short and long term profits in almost any market. You’ll discover how to identify otherwise hidden profit chances that most traders overlook.
Add to wishlist


Reviews
There are no reviews yet.