Swing trading indicators can come along and change the whole game as they ease the process but also provide many false signals. Such a double-edged benefit of technical tools makes many swing traders hesitate about whether they should use these indicators. This article offers an exclusive overview of the common technical indicators for swing trading. So, you can learn how to leverage their superior functions to help you earn higher profits from swing trading.
What’s Swing Trading and How Does It Work?
Swing trading indicators a type of fundamental trading where you can hold positions longer than a single day. Technical analysis plays an important role in the development and modification of swing trading strategies. It generates practical insights into the patterns of market trends. So, you can easily forecast the next price movements to capture opportune timing.
Moreover, swing traders can use fundamental analysis to look beyond ‘superficial’ ups and downs. It supports them to measure the intrinsic values of assets so they can better analyze price trends and patterns.
It is typical to hold a position for more than one trading session but it should not expand to several weeks or a few months. Swing traders aim at earning from a chunk of a potential price move. Two noticeable trends in swing trading include seeking out volatile stocks and sedate stocks. Whatever stocks people choose, the entire process involves the identification of next price movements, timing of trade entries, either gaining or losing, etc.
The Importance of Understanding Swing Trading Indicators

There are three aspects of a trade that you should take into consideration, trends, momentum, and volume. Thus, the help of tools in such areas can help you profitably swing trade no matter how volatile the market is.
- Trend Indicators bring clarity to the direction of the market so that you will not be a victim of price volatility. As you can see the primary trends among distracting factors through the use of these tools. Moving averages are the noticeable representatives.
- Momentum Indicators indicate the strength of a trend so that you can determine whether a reversal can take place or not. Simply put, you can identify whether you can tell security is overbought or oversold to develop a feasible strategy.
- Volume Indicators entail the number of trades that swing traders buy and sell on an asset over some time.
Top Swing Trading Indicators

Moving Averages (MAs)

Moving averages (MAs) are a stock indicator that you typically find in technical analysis. This tool can mitigate short-term fluctuations in stock prices over a specified time frame. So, the price data becomes much more understandable and generates more valuable insights.
Due to taking past prices as the base, people attach MAs to the name lagging indicators. For instance, a 100-day moving average will have a much higher degree of lag than a 10-day MA as it uses the database of the past 100 days.
There are three categories of MAs, including short, medium, and long terms. The factor to categorize these types is the number of periods that investors and traders want to analyze. Short terms include 5 to 50-period MAs. Medium terms include 50 to 100-period MAs. Long terms involve 100 to 200-period MAs. Swing traders and investors usually take notice of 50-day and 200-day MAs as they are crucial trading signals.
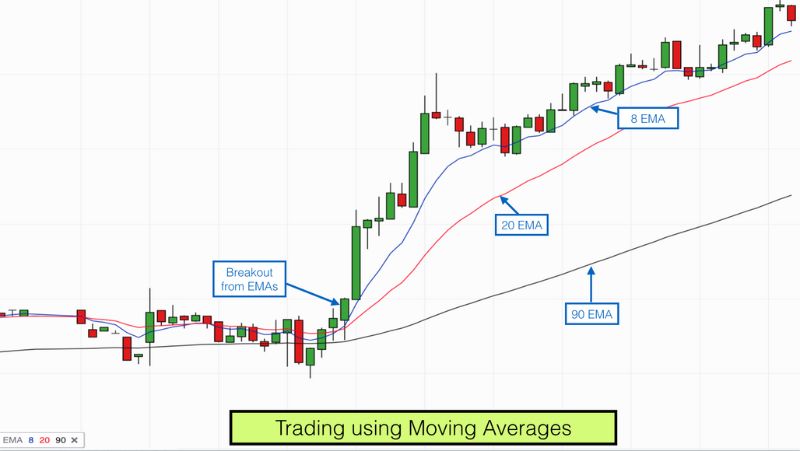
Simple moving averages (SMAs) calculate a given set of prices in a specific number of days in the past. Meanwhile, exponential moving averages (EMAs) offer more weight to price action which uses updated databases.
It is nearly impossible to accurately forecast the next price action all the time. Yet, technical analysis and research can boost the accuracy of market forecasting. A rising moving average indicates the uptrend while a declining one is the signal of a downtrend.
You can confirm upward momentum through a bullish crossover. It takes place when a short-term moving average crosses beyond a longer-term MA. Reversely, a bearish crossover is a signal of downward momentum.
Volume
Volume is also a technical analysis tool that many swing traders use to better analyze the strength of a new trend – whether it can last or not amidst multiple influential factors. The underlying principle is simple: if a trend comes along with a high volume, it shows much more strength than the trend with a weak volume.
For those who hesitate about whether they should buy or sell, the volume offers a good base for price movement. It can be an ideal companion to a breakout strategy that follows a period of consolidation.
Volume indicators are helpful in a wide range of markets and instruments, such as equities, futures, forex, etc. When a market witness increased volume in its rise, it is the signal of being under accumulation. The market’s fall on increased volume indicates being under distribution.
Meanwhile, if the market rises on a decreased volume, it involves a bearish divergence. A market drops on a decreased volume, it is a signal of a bullish divergence.
Volume indicators are powerful forex swing trading indicators as it helps the evaluation of price movement in a specific period, instead of looking at individual buy and sell transactions. Also, forex traders use volume in conjunction with price action to better analyze trend strength, confirm breakouts, etc.
Ease of Movement (EOM or EMV)
Ease of Movement indicator clarifies the relationship between price and volume so that the strength of an underlying trend can be under the spotlight. Simply put, the tool helps swing traders determine whether prices can rise, or fall, with little resistance in certain movement directions.
This indicator shows the result on a chart with a baseline of zero. If EOM increases above zero, it is the signal of developing prices with relative ease. Conversely, if EOM falls below zero, it will indicate the market’s drops with increasing ease.
For example, assumingly that Microsoft stock increases from $140 to $150 in a single day. Yet, its EOM spikes throughout the period. When high volume is not the reason why the new volatility takes place, it indicates a lack of strong bull sentiment and paves the path for potential bearish movements.
Relative Strength Index (RSI)
Relative strength index is helpful to determine whether a stock’s price is strong or not. So, it is among the crucial momentum indicators in technical analysis. Specifically, it gauges the speed and magnitude of an asset’s recent price changes to assess overvalued or undervalued conditions.
Besides, RSI can generate insights into whether securities are about to go in a trend reversal or corrective pullback in price. So, you can identify the optimal timing to buy and sell to win the highest gains while losing the least.
The chart will move from zero to 100 to show the strength of a stock’s price. If it goes beyond 70, it indicates the overbought condition. It might be good to open a short position. Meanwhile, when the RSI declines below 30, it shows oversold territory so traders should go long.
Stochastic Oscillator
Stochastic oscillator is an indicator that has the same operating system as the RSI. It indicates the market movements through the comparison of the closing price of a market to the range of its prices in a specific period.
The difference between a stochastic oscillator with RSI is the inclusion of two lines – one indicates the current value of the oscillator, and another line shows a three-day moving average (MA).
Using the same scale from 0 to 100 with the RSI, the stochastic oscillator supports the identification of the overbought/oversold levels. When the metric points over 80, it is the signal of overbought stocks. Meanwhile, if the point is under 20, it indicates the oversold stocks.
Yet, even though the stochastic oscillator’s range-bound metric shows the overbought/oversold level, it is not necessarily the signal of an impending reversal. As strong trends can extend their overbought/oversold conditions. So, swing traders should look to changes in the tool for hints about future movement shifts.
MACD
MACD stands for Moving Average Convergence Divergence. This trend-following momentum indicator points out the relationship between two moving averages of an underlying asset’s price. You can get the result of MACD by subtracting the 26-period EMA from the 12-period EMA.
The MACD line on top of which is a nine-day EMA (the signal line) of the MACD can work as a trigger for the signals of buying and selling. Swing traders may purchase the underlying asset when the MACD crosses beyond its signal line. Reversely, if it crosses below the signal line, they should sell or short the security.
Besides, you can read MACD as an approach to seeking divergence between the histogram and the price action. It usually forecasts a trend reversal.
Yet, you should be careful with the possibilities of generating false positive signals. When you all prepare for a possible reversal that does not happen, it can be time-consuming and take a lot of effort.
Bollinger Band
A Bollinger band, a technical analysis tool, entails a group of trendlines with two standard deviations. These deviations are apart from a simple moving average (SMA) of an asset’s price.
A well-known technical trader, John Bollinger, was the man behind this tool. He developed this tool to uncover the opportunities that enable swing traders and investors to accurately identify the timing of an overbought/oversold asset.
The tool’s creator developed a set of 22 rules that you should follow when using the bands as a trading system. For example, when the prices are close to the upper band, the market tends to move to the overbought state. Reversely, when the prices move to the lower band, the oversold state tends to occur.
This tool generates insights into the squeeze – a central concept of Bollinger Bands, and breakouts – not just a trading signal.
Specifically, when the bands come close together with constricted MA, a squeeze takes place. It indicates the low volatility which leads to potential future rising volatility and an opportune time for earning profits.
If a breakout is above or below the bands, it is a major event. You should not take insights related to breakouts as clues as to future price movements. Many techniques and strategies can go wrong due to misleading signals, so be careful of the insights you get from tools.
Bullish Candlestick Reversal Patterns
There are five powerful patterns that showcase bullish candlestick reversals, such as hammer, piercing, bullish engulfing, morning star, and three white soldiers.
- The creation of a hammer pattern takes place when the open and close prices meet each other. It comprises a lower shadow that is twice as long as the real body.
- Piercing pattern is a candlestick pattern that offers us potential bullish reversal signs near the support levels when a downtrend ends.
- Bullish engulfing informs a potential reversal from a downtrend as more buyers join the market and move the prices up after a long period of downward movement.
- Morningstar is a triple pattern of candlesticks telling us a bullish reversal in advance. In other words, it warns us of the upcoming uptrends.
- Three white soldiers, also a bullish candlestick pattern, takes place at the end of a downtrend and showcases a bullish reversal. It includes three long bullish candlesticks that are green in color but not long shadows.
>>Article you should read: Best Swing Trading Strategies and Techniques to Use in 2022
Other Indicators used for Swing Trading
Support and Resistance
Support and resistance refer to areas on a market’s chart with challenges of crossing. They create the basis of main technical strategies for many trading types, and swing trading is no exception.
When the drop of the market to a support area happens, bulls will turn up to create higher market bounces. Reversely, when the market comes into the area of resistance, bears will step in to balance it down. This tool can help swing traders identify ‘sweet spots’ to open and close trades at the optimal timing.
If the market often bounces off a support or resistance line, the bounce’s strength will be enhanced. In the case of moving beyond that area, the possibility of a breakout is high.
Patterns
There are many swing trading patterns that you can use as hints for potential uptrends and reversals.
- Wedges help you identify reversals. If a wedge falls on a falling market or rises on a rising market, it can be a signal of an upcoming price reversal.
- Pennants can be a factor leading to new breakouts as the market consolidates after a considerable price action.
- Triangles are a precursor to a breakout in the case of the pattern’s invalidation.
- Standard head and shoulders are the pre-ups for bear markets. Meanwhile, inverse ones can be the beginning of uptrends.
How to Start Using Swing Trading Indicators
These tools will be a great help for swing traders to identify the timing and methods of opening trade or position. You can find optimal entry points with the aid of the signals that the superior features of these tools can offer.
You should conduct some research online for the best suppliers of these indicators before buying or downloading these tools. Understanding their operation, the pros, and cons, etc. can help you to leverage their features to earn higher profits and undertake lower risks.
Why Should use Swing Trading Indicators
The swing trading indicators that we introduce in this article are the basic tools that many swing traders have used to better their trades. You can see those indicators showcase three primary dimensions of a trade, including trend strength, momentum, and volumes.
Researching the disadvantages and advantages of these tools can help you better leverage their functions. Thus, you can profitably and confidently swing trade amidst the volatile price actions.


