The IBD’s Level 3 course by Chart School (or The IBD Chart School) is jam-packed with lessons on how to improve positions, identify IPOs poised to break out, and comprehend charts at a deeper level.
Course overview
Deeper understanding of charts to maximize gains and protect capital with the IBD Chart School. This advanced session, delivered by O’Neil Data Systems, Inc. Portfolio Managers Charles Harris and Mike Webster, is packed with information on how to improve positions. Furthermore, the IBD Chart School identifies IPOs that are poised to break out, and comprehend charts at a deeper level. You’ll also master crucial selling tactics for boosting profits and capital preservation.
Course outline
An in-depth examination of how to acquire stocks, including:
- Purchase points and alternative purchase points
- 50 examples of correct and incorrect cup-with-handles.
- There are over ten examples of each of the other bases.
- Introduction to Initial Public Offerings (IPOs) and Initial Bases.
Offensive and defensive selling methods include the following:
- There are 15 distinct sell signals and dozens more instances.
- When should you learn to sell:
- The stock is gaining in value, but there are warning signs.
- The stock’s price is falling and displaying signs of fragility.
- Money management techniques
- Learn important concepts like follow-up purchasing, utilizing average cost, and aligning your trading style to your financial goals.
- Learn how to manage your positions effectively in any market.
Workbook: With over 500 pages crammed with hundreds of examples, this enormous 11′′x17′′ workbook makes chart reading and detecting bases easier than ever.
What will you learn?
- In-depth examination of how to acquire stocks, covering alternate pivot points, IPOs, and identifying flawed bases.
- Offensive and defensive sell signals, including 15 distinct sell signals and hundreds of instances
- Money management techniques
Who is this course for?
The IBD Chart School is designed for:
- Those who want to better enhance positions.
- Those who want to briskly find IPOs ready to break out.
- Those who need to understand charts at a deeper level.
- Those who need to learn the essential selling strategies for maximizing gains and protecting capital.
Please Login/Register if you want to leave us some feedback to help us improve our services and products.
RELATED COURSES
VIEW ALL-
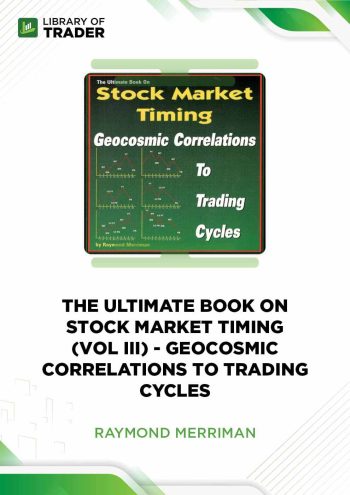 The Ultimate Book on Stock Market Timing (Vol 3): Geocosmic Correlations to Trading Cycles – Raymond MerrimanDOWNLOADThe Ultimate Book on Stock Market Timing (Vol 3): Geocosmic Correlations to Trading Cycles – Raymond MerrimanUpdate 09 Nov 2022All LevelsDOWNLOAD
Geocosmic Correlations to Trading Cycles by Raymond Merriman is the third book in the extraordinary series of conquering the stock market with astrology.
Add to wishlist -
 Introduction to Position Sizing Strategies – Van Tharp InstituteDOWNLOADIntroduction to Position Sizing Strategies – Van Tharp InstituteUpdate 02 Nov 2022DOWNLOAD
If you are having difficulty assessing and minimizing your trading risks, then you want a practical method to understand risk and learn how to reduce losses. This Introduction to Position Sizing Strategies course by Van Tharp Institute is unquestionably for you
Add to wishlist -
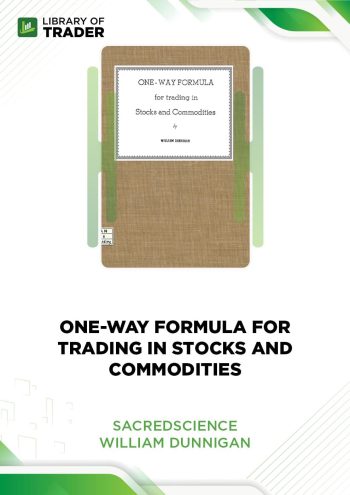 Sacred Science: One-way Formula for Trading in Stocks and Commodities – William DuniganDOWNLOADSacred Science: One-way Formula for Trading in Stocks and Commodities – William DuniganUpdate 12 Nov 2022All LevelsDOWNLOAD
Sacred Science: One-way Formula for Trading in Stocks and Commodities by William Dunigan shares comprehensive walkthroughs of effective strategies in stocks and commodities.
Add to wishlist -
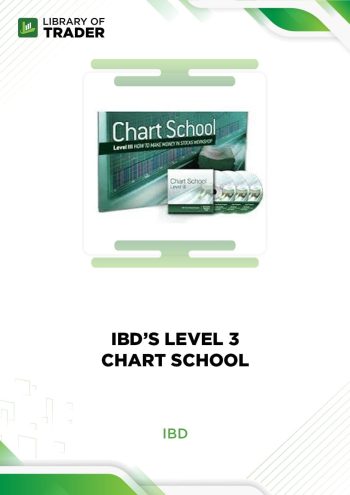 IBD’s Level 3 – Chart SchoolDOWNLOADIBD’s Level 3 – Chart SchoolUpdate 03 Nov 2022DOWNLOAD
The IBD’s Level 3 course by Chart School (or The IBD Chart School) is jam-packed with lessons on how to improve positions, identify IPOs poised to break out, and comprehend charts at a deeper level.
Add to wishlist -
 Trade Stocks and Commodities with the Insiders: Secrets of the COT Report – Larry WilliamsDOWNLOADTrade Stocks and Commodities with the Insiders: Secrets of the COT Report – Larry WilliamsUpdate 11 Nov 2022All LevelsDOWNLOAD
Trade Stocks and Commodities with the Insiders: Secrets of the COT Report reveals industry secrets that help investors and traders successfully invest and trade side-by-side with the largest commercial interests in the world.
Add to wishlist -
 Winning Chart Patterns – Ken CalhounDOWNLOADWinning Chart Patterns – Ken CalhounUpdate 11 Nov 2022BeginnerDOWNLOAD
Winning Chart Patterns by Ken Calhoun helps you to learn about technical analysis. It contain 4 videos by ken calhoun from trading television and day trading university.
Add to wishlist


Reviews
There are no reviews yet.