Understanding and studying day trading indicators is important. They help you give grounded directions and forecasts. There are many indicators to help you do this depending on your trading strategy and mindset. You need to understand your position, understand the indicators and their role. This will help you create the correct strategy, which greatly determines your chances of expanding your account.
How Are Day Trading Indicators Explained?
As with all other types of trading, day traders appreciate the importance of using indicators. Whether you are interested in forex trading, commodity trading, or stock trading, it can be helpful to use technical analysis as part of your strategy. This includes the study of various trading indicators.
Day trading indicators are mathematical calculations, drawn as lines on a price chart, and can help traders identify certain signals and trends in the market.

Day Trading Technical Analysis
What Is Day Trading Technical Analysis?
Chart patterns and bar (or later candlestick) analysis are the most common forms of analysis, followed by regression analysis, moving averages, and price correlation. The range of technical day trading indicators is larger today. Anyone with coding knowledge related to a software program can convert price or volume data into a particular indicator of interest.
While technical analysis alone cannot completely or accurately predict the future, it is useful for identifying trends, behavioral trends, and potential mismatches in supply and demand in order to spot trends. Where trading opportunities may appear.
How To Apply Day Trading Technical Analysis
There are several methods to approach day trading technical analysis. The simplest method is through a basic candlestick price chart, which shows price history and buying and selling dynamics over a specified period of time.
Other investors use price charts in conjunction with technical day trading indicators or use specialized forms of technical analysis, such as Elliott wave theory or harmonics, to generate trading ideas. Some take advantage of parts of different methods.
What Indicators To Use For Day Trading?
Here are some indicators for day trading that every trader should know:
Moving Averages
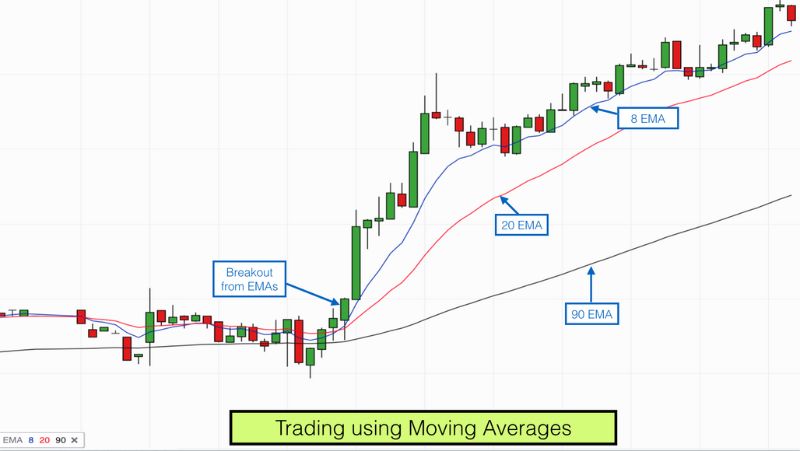
Moving averages are often used by technical analysts to track the price trend of specific securities. Moving averages allow traders to find trading opportunities in the direction of the current market trend.
Technical analysts will use moving averages to detect if a change in momentum has occurred for a security, such as whether there is a sudden change in the price of a security or not.

Bollinger Bands
Bollinger Bands are a lagging indicator that can help you determine if prices are relatively high or low and can be useful for better understanding volatility. The price of a stock moves between the upper and lower bands. When the market is moving and volatility is greater, the range will widen, and when volatility is less the gap will decrease.
Bollinger Bands come in 3 types: the middle band is a 20-day simple moving average, the upper band has a standard deviation of +2, and the lower band has a standard deviation of -2.
RSI & MACD
Consider combining the two sets of day trading indicators on your price charts to help identify points to start and exit trades. When choosing pairs, you should choose one that is considered a leading indicator like Relative Strength Index (RSI) and one that is a lagging indicator like Moving Average Convergence Divergence (MACD).
The leading indicators generate signals before the entry conditions appear. Lagging indicators generate signals after such conditions appear, so they can act as a confirmation of leading indicators and can prevent you from trading on false signals.
Stochastic Oscillator
The stochastic oscillator is a momentum indicator based on the closing price trend. It was explored in the 1950s by George Lane. Traders use the stochastic oscillator to find overbought and oversold levels.
It is a range-bound indicator from 0 to 100 (at the base and the top respectively). Using that range, you can find sell signals when the line crosses from above to below 80 and buy signals when it crosses from below to above 20.
Trend
Specific indicators indicate the direction of the market or the direction the market is moving. Usually, trend indicators are oscillators, they tend to move between high and low values.

Momentum
Momentum indicators show the strength of the trend and also signal whether there is any possibility of a reversal. The Relative Strength Index (RSI) is a momentum indicator, it is used to indicate the top and bottom of the price.
Volume
How the volume indicator changes over time, it also shows how many shares are being bought and sold over time. When the price changes, the volume shows how strong the move is. On-Balance Volume is one of the well-known volume indicators.
Volatility
Volatility is one of the most important indicators, it shows the price change in a certain period of time. Volatility shows how the price is changing. High volatility indicates high price volatility, lower volatility indicates high volatility.
What Are The Best Indicators For Day Trading?
Each trader’s advantage will be different so there are no single best day trading indicators. Some traders will mainly rely on the RSI, while others may find it difficult to test the RSI. All indicators can be used equally well to buy or sell stocks.
For example, when the RSI is low, it can be seen as a buy signal to a bullish trader, just as a high RSI can be a short-term signal to a bearish trader.
However, traders will also prefer to choose day trading indicators that support them regularly like
- Moving average
- Bollinger Bands
- Momentum Oscillator
- RSI
How Reliable Are Day Trading Indicators?
Technical analysis is the reading of market sentiment through the use of chart patterns and signals. Various experimental studies have shown its effectiveness, but the extent of its success varies widely and its accuracy remains undecided.
It is best to use a set of technical tools and indicators in tandem with other techniques such as fundamental analysis to improve reliability.
What Do You Need To Know Before Using Day Trading Indicators?
The first rule of using trading indicators is that you should never use a single indicator or use too many indicators at once. Focus on a few things that you think are most relevant to what you’re trying to achieve. You should also use technical indicators in conjunction with your own assessment of the movements of an asset’s price over time.
Day traders should keep in mind that you must confirm a signal in some different way. If you get a ‘buy’ signal from an indicator and a ‘sell’ signal from the price action, you need to use different indicators or different time frames until your signal is confirmed.
Another important thing to remember is that you must never lose sight of your trading plan. Your trading rules should always be followed when using indicators.
The Bottom Line
Day Trading Indicators are an integral part of successful trading. Each indicator has its own function to assist traders in technical analysis as well as trend forecasting and account health. See more related articles for more useful trading knowledge from the Library of Trader!


