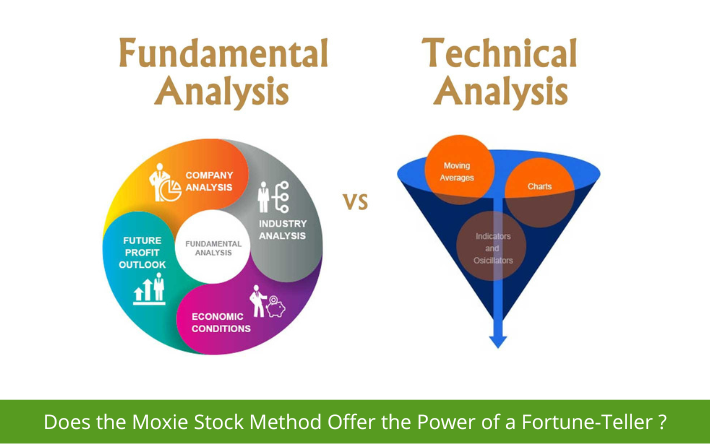
Fundamental analysis and technical analysis are two of the most frequent methodologies used by investors to assess the advantages and dangers of long-term stock market investing. Both investors and traders can seek for investments/trading transactions that have a higher chance of optimizing their profits over time.

Understanding the distinctions between fundamental research and technical analysis may provide investors and traders with three essential stock-picking tactics for making lucrative investment selections.
1. What is Fundamental Analysis and Technical Analysis?
1.1 What is Fundamental Analysis?

Fundamental analysis is used to assess stocks by attempting to calculate their intrinsic worth. Fundamental analysts research everything from the broader economy and industry circumstances to particular firms’ financial soundness and management. Fundamental analysts scrutinize earnings, costs, assets, and liabilities.
Related Course: Macro Fundamentals Trading Course
1.2 What are the Different Types of Fundamental Analysis?
Fundamental analysis is classified into two types: qualitative and quantitative. The qualitative approach is influenced by goodwill, market circumstances, brand value, and corporate performance. Quantitative analysis, on the other hand, is based on statistics.
| Qualitative Analysis | Quantitative analysis |
| The examination of a firm’s goodwill, customer behavior, demand, and corporate recognition in larger marketplaces constitutes qualitative analysis. It seeks answers to topics such as how it is seen, how management choices or announcements create market buzz, and how it differs from its competitors. Furthermore, its brand value and other similar elements reflect its socioeconomic and commercial position. | Statistics, reports, and data are common components of quantitative analysis. It is entirely based on its financial statements, quarterly results, balance sheets, debt, cash flow, and so forth. It entails evaluating figures, ratios, and values in order to comprehend the share price and the overall financial health of the organization. |
1.3 What is Technical Analysis?

Technical analysis varies from fundamental analysis in that traders seek to spot opportunities by examining statistical trends such as price and volume changes in a stock. The underlying premise is that all known fundamentals are priced in, hence there is no need to pay careful attention to them. Technical analysts do not attempt to calculate the inherent worth of a securities. Instead, they utilize stock charts to spot patterns and trends that indicate how a stock will perform in the future.
1.4 What are the Different Types of Technical Analysis?
Technical analysis charts are classified into three types: candlestick, bar, and line charts. They’re all made using the same pricing data but present it in different ways. As a consequence, they employ several forms of technical analysis to assist traders in making educated judgments in the forex, stocks, indices, and commodities markets. While there are many various types of charts, this article will only discuss the top three because they are the most popular.
| Candlestick | Bar | Line charts |
| A candlestick chart depicts the high, low, open, and closing (HLOC) prices for each candle period. Each candlestick’s “body” reflects the opening and closing prices, while the candle’s “wicks” indicate the high and low prices for each period. The color of each candle is determined on the parameters used, however most charting tools use green and red as the default colors. Green candles indicate that the price closed higher than it opened (a bullish candle), while red candles indicate that the price finished lower than it opened (often called a bearish candle). |
A bar chart depicts the high, low, open, and closing (HLOC) prices for each bar period. The vertical line is formed by the bar’s high and low prices. The dash to the left of the bar represents the initial price, while the dash to the right represents the closing price. Knowing whether a bar closes up (green) or down (red) reveals the market attitude (bullish/bearish) for that period to the trader. |
A line chart normally displays only the closing prices. Each closing price is connected to the preceding closing price to form an easy-to-follow continuous line. Because it is basic and easy to understand, this style of chart is frequently used in television, newspapers, and numerous websites. It contains less information than candlestick or bar charts, but it is excellent for a quick glimpse at the market. |
1.5 What is the difference between Fundamental Analysis and Technical Analysis?

As shown in the table below, Fundamental Analysis and Technical Analysis differ greatly:
| Comparison Factors | Fundamental Analysis | Technical Analysis |
| Definition | Fundamental analysis is the technique of evaluating securities in order to determine the stock’s intrinsic worth. | Technical analysis is a way of predicting the future price of a company by examining charts for patterns and trends. |
| Goal | To determine a company’s fair value by assessing all components of the firm, as well as the industry, the market as a whole, and the local and worldwide environment. | To analyze data, including past returns and price movements, in order to create patterns that may be utilized to forecast future price movement for securities and the market as a whole. |
| Focuses on | Past and present data | Past data only |
| Types of data | Economic outlooks, News events, Industry statistics, Balance sheet, Past performance, Financial reports. | Chart Analysis, Past trends, Stock charts, Price history, Market Psychology. |
| Function | Investing | Trading |
| Concepts used | Return on Equity (ROE)Return on Assets (ROA) | Dow Theory Price Data |
2.Which is better: Fundamental Analysis or Technical Analysis?
In trading and investing, neither Fundamental Analysis nor Technical Analysis is completely reliable. Both traders and investors must study these two methodologies based on their advantages and disadvantages to determine which is the most appropriate for them.
The pros and cons of both methods are summarized below:
| Fundamental Analysis | Technical Analysis | |
| Advantages | Analytical methodologies: Fundamental analytical methods and approaches are based on reliable financial data. It eliminates the possibility of personal prejudice. A 360-degree perspective: Fundamental analysis takes into account long-term economic, demographic, technical, and consumer trends. A systematic approach: The statistical and analytical methods employed aid in arriving at an appropriate Buy/Sell recommendation. Better Understanding: Thorough accounting and financial analysis aid in determining a better understanding of everything. | Volume-trend-based insights: The trading market is governed by Demand and Supply Law. Hence, it reveals a great deal about traders’ attitudes. You can assess how the market as a whole is performing. Better decision on when to enter/exit: Technical analysis can help you decide whether to enter or quit a game. Up-to-date data: The price of an asset reflects all available information about it. Prices may rise or fall, but the present price is the balance point for all information. Better directions with pattern charts: You may utilize patterns to influence your purchase and sell decisions. |
| Disadvantages | Time-consuming: Conducting industry analysis, financial modeling, and valuation is not easy. It can become intricate and time-consuming. Assumptions centric: Financial forecasting relies heavily on assumptions. As a result, it is critical to analyze both the best and worst-case scenarios. Problems may arise as a result of unexpected negative economic, political, or legislative changes. | Too many indicators muck up the charts: Having too many indicators might result in confused signals that impact your research. Underlying fundamentals are ignored: Technical analysis does not take into account a company’s underlying fundamentals. It can be dangerous in the event of lengthy time spans. |
3. How to Integrate Fundamental and Technical Analytics in Your Trading Strategy?

Fundamental and technical analysis can be combined in a variety of ways. The following are two instances of how three distinct technical analysis methodologies may be used with fundamental analysis to generate better insights:
- Using range bound trading in conjunction with fundamental analysis
- Using oscillators in conjunction with basic analysis
3.1 How to use range bound trading in conjunction with fundamental analysis?
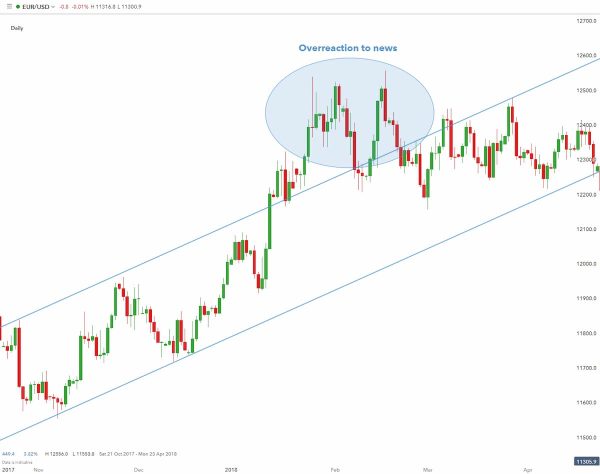
Range bound trading seeks to discover a market’s price channel, which a trader may employ to purchase at lower trendline support and sell at higher trendline resistance.
In a strong up trending market, traders want to enter or purchase at the lowest feasible price to maximize their profits. News developments, on the other hand, can destabilize a range-bound market. In this situation, the trader would avoid open deals near the time of the news announcement (due to low retail sales’ and ‘durable goods orders’ data). The chart clearly demonstrates this disturbance, following which the price level recovers to previous range bound levels.

3.2 How to use oscillators in conjunction with basic analysis?
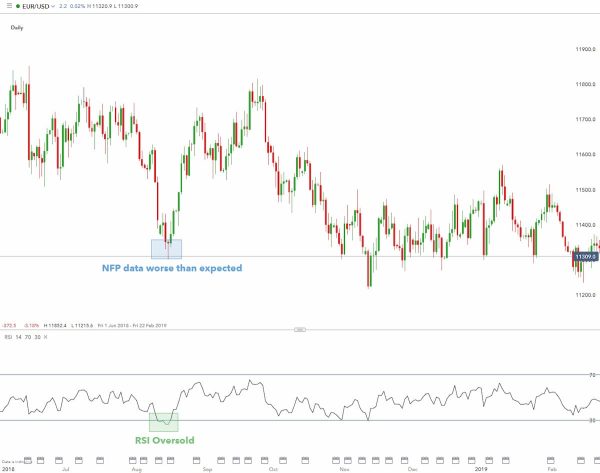
Oscillators are often used as technical instruments for detecting short-term overbought/oversold circumstances. There is an example of employing an RSI indicator (technical indicator) in conjunction with a Non-farm Payroll (fundamental indicator) data release, one of the most important fundamental indicators in US history, in the chart below.
The NFP result came in lower than expected, causing the USD to fall, as seen by the significant positive move on EUR/USD. When the NFP is set to be revealed, if you expect it to be lower than predictions based on recent developments in the US, EUR/USD may become more volatile, making it a good time to sell, and vice versa.

4. To sum up: Key points about Fundamental Analysis and Technical Analysis.
- Fundamental analysis is a process of studying securities in order to determine their inherent worth for long-term investment prospects. Technical analysis, on the other hand, is a way of analyzing and estimating the price of an asset in the future based on price movement and transaction volume. It predicts what a stock will perform in the future.
- While fundamental analysis seeks to determine the stock’s actual intrinsic value, technical analysis is used to determine the best timing to enter or exit the market.
- Decisions in fundamental analysis are based on the information provided and the statistics examined. Technical analysis, on the other hand, bases decisions on market movements and stock prices.
- Fundamental analysis considers both past and present data, whereas technical analysis solely considers historic data.
- Fundamental analysis is founded on financial statements, whereas technical analysis is founded on price movement charts.
- There are two typical ways to combine fundamental analysis and technical analysis:
- Using range bound trading in conjunction with fundamental analysis
- Using oscillators in conjunction with basic analysis


