Using Point and Figure Charts to Analyze Markets – Tom Dorsey offers an up-to-date look at point and figure charting from one of the foremost authorities in the field.
Course overview
Using Point and Figure Charts to Analyze Markets – Tom Dorsey reveals an investment approach that has stood the test of time, during both bull and bear markets, and is easy enough to learn, whether you’re an expert or aspiring investor. Filled with in-depth insights and expert advice, this practical guide will help you grow your assets in any market.
This course is designed for Technical Analysis.
Course Outline
- Video Clip: Tom Dorsey Using Point and Figure Charts to Analyze Markets
What will you learn?
- Step-by-step, how to create, maintain, and interpret your own point and figure charts with regard to markets, sectors, and individual securities.
- How to use other indicators, including moving averages, advance-decline lines, and relative strength to augment point and figure analysis.
- How to use this approach to track and forecast market prices and develop an overall investment strategy.
- How to use point and figure analysis to evaluate the strength of international markets and rotate exposure from country to country.
Who is this course for?
This course is ideal for those who want to master their skills of point and figure charting to grow their assets in any market.
Tom Dorsey
Please Login/Register if you want to leave us some feedback to help us improve our services and products.
RELATED COURSES
VIEW ALL-
 Robotic Trading: Skill Sharpening – ClayTraderDOWNLOADRobotic Trading: Skill Sharpening – ClayTraderUpdate 12 Nov 2022All LevelsDOWNLOAD
Getting practical insights from stock charts is the skill you can improve through Robotic Trading: Skill Sharpening by ClayTrader. Be a better trader who can earn more!
Add to wishlist -
 The Handbook of Pairs Trading – Douglas S.EhrmanDOWNLOADThe Handbook of Pairs Trading – Douglas S.EhrmanUpdate 20 Dec 2022All LevelsDOWNLOAD
Douglas S. Ehrman is the Chief Executive Officer and one of the founders of Alpha Africa Asset Management LLC in Chicago. He was also the CEO of AlphAmerica Financial, Inc., the business that ran PairsTrading.com prior to its merger with PairTrader.com. In this book, he explains the theory and practice of pairs trading.
Add to wishlist -
 Sniper Trading Workbook (tradewins.com) – George AngellDOWNLOADSniper Trading Workbook (tradewins.com) – George AngellUpdate 02 Nov 2022All LevelsDOWNLOAD
Sniper Trading Workbook (tradewins.com) by George Angell is designed to be used with Sniper Trading with all the formulas and strategies covered here are outlined in that text.
Add to wishlist -
 Wyckoff Starter Series – LTG TradingDOWNLOADWyckoff Starter Series – LTG TradingUpdate 29 Nov 2022All LevelsDOWNLOAD
The Wyckoff Starter Series by LTG Trading is an ideal course for those who are interested in the Wyckoff principles and want to build a solid foundation. This course covers multiple aspects with detailed instructions and illustrated case studies.
Add to wishlist -
 50 Cal Black Ops – FX CartelDOWNLOAD50 Cal Black Ops – FX CartelUpdate 09 Nov 2022All LevelsDOWNLOAD
The 50 Cal digital course will teach you how hundreds of people make a second income trading the Forex market. This course will provide you access to all of FXCartel’s strong methods from the comfort of your own home.
Add to wishlist -
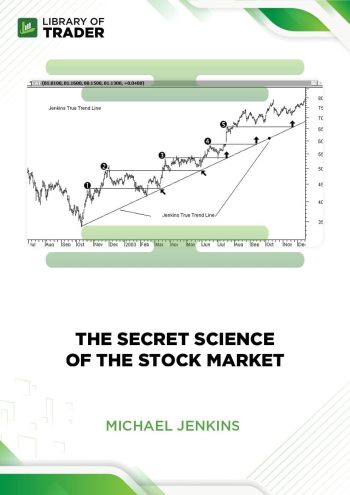
 Michael Jenkins – The Secret Science of the Stock MarketDOWNLOADMichael Jenkins – The Secret Science of the Stock MarketUpdate 07 Nov 2022All LevelsDOWNLOAD
The Secret Science of the Stock Market – Michael Jenkins reveals the needed knowledge that allows you to forecast any market with great accuracy. The course is all about time and price to maximize your profits while limiting risks.
Add to wishlist


Reviews
There are no reviews yet.