What Are Gann Indicators?
Understanding Gann Theory
William D. Gann created the Gann theory in the early 1900s. To understand the Gann theory calculations, you need to study the behavior of the following three things in the market.
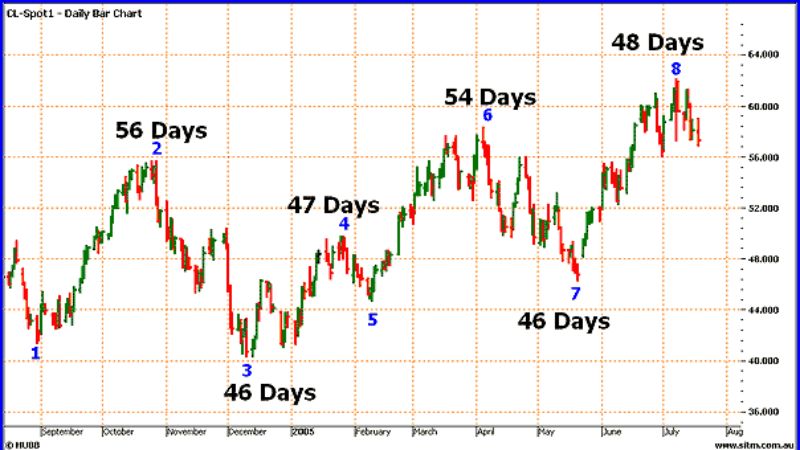
- Time Cycle: Gann believed the time cycle existed, meaning that everything that has happened before is most likely to repeat in the near future.
- Price Study: By analyzing and evaluating the data of the period, including the short-term and long-term market highs, traders can draw angles that suggest the price pattern of an asset or a stock.
- Pattern Study: Pattern study is used to evaluate investors’ activities in addition to stock movements.

Understanding Gann Indicators
Gann indicators are techniques built and developed by WD Gann. Their purpose is to predict support and resistance levels and future price movements. Gann trading techniques are still widely applied today and give traders remarkable results.
Even though the futures and stock markets have evolved significantly over the years, Gann studies have been utilized by active traders for decades and are still a common technique for determining the course of an asset.
The Gann angle is a popular trading tool and technical analysis used to measure key factors, such as pattern, price, and time.
The foundation of Gann indicators is the idea that markets rotate from one angle to the next, and that when one angle is broken, the price goes to the next. A Gann Fan is formed by several angles together.
Even though the futures and stock markets have evolved significantly over the years, Gann studies have been utilized by active traders for decades and are still a common technique for determining the course of an asset.
How to Use Gann Indicators
Application of Gann Indicators
Traders can use Gann indicators time as well as price theory to study patterns as explained.
- Price Study: With the help of Gann angles, you can follow the price movement of a stock. You can identify the future price movement of a stock using the pivot levels and predict the stock price using the resistance levels and support levels.
- Time Study: With Gann’s time study model, traders can grasp the idea of which the stock’s price can reverse. By reading the historical data and analyzing the stock’s price at a different point in time, traders can estimate at what point the price of the stock can reverse.
- Pattern Study: Traders can use patterns to find the movement of stock. Pattern study uses the trend and patterns to show the reversal in the stock’s movement.
How to Use Gann Fan Indicator
The market is always in motion and goes from one angle to another. The rule of all angles states that an asset moves from one angle to another when it has reached an angle. The purpose of the Gann angle is to identify support and resistance lines.
The stock price drops if the break when the support is broken. Or in the other case, a flare-up Gann indicates that the resistance area has been broken and the price will drop. Once a trader has established his or her timeframe, he or she draws Gann angles on a stock chart. These angles can be 1X1, 2X1, 3X1, 1, X2, X3, etc. These lines can be used to determine a trader’s needs and then they are used to interpret price movement.
How to Use Gann Indicators in Stock Market
To trade stocks using the Gann theory, you need to follow the following procedure and assumptions.
- A time cycle governs stock market movements.
- Markets are geometric in their movement and design.
- A market is only affected by time, price, and range.

Traders should consider that the market moves in different angles that will remain the same and can only be rotated. According to the “Rule of All Angles”, an asset can move from one angle to another once it has achieved an angle. Therefore, Gann angles are commonly used to locate support and resistance lines.
When support is broken, it is called a break and the price will drop. When it breaks out, resistance has been broken and the price will move down.
You can start drawing the Gann angles on the stock chart after setting your time frame. You can choose any angle such as 1X1, 2X1, 3,X1, 3X1, 1,X2, 1,X3, and so on. These lines can be used not only to determine the need of the trader but also to interpret the price movement.
Note: Uptrend angles indicate support, while downtrend angles indicate resistance.
Sometimes, you can combine horizontal and angles to determine support or resistance. In case a stock is bullish, it may retrace to 50% and this level will serve as support for the stock. On the other hand, if the stock is bearish, the 50% retracement level is now an important resistance level. These angles act as important support and resistance levels for assets that have been trading at different angles.
How to Use Gann Indicators for Intraday Trading
The Gann theory is considered one of the best methods for intraday trading. To make the most of it, you need to follow the following procedure and assumptions.
- The 180 degree is assumed as number 1.
- The resistances will be derived from the low and supports from the high in every 15-degree interval.
- We buy the stock in the price cross over of 30-degree in the resistance side and vice-versa.

Keep in mind that we will use this method for making swing trades, which means we will close our buy position at the sell entry point and initiate fresh short at that point. Sometimes we will come across the situation where the buy entry and sell entry will be placed very close to each other or even equal to each other. This is called the congestion band. If the congestion band is present, you should make an entry on the 1st target point.
It might be overwhelming at first to learn the Gann theory. However, as it is an important technical analysis tool that provides up to 90% accuracy, it is well worth your time and effort. If Gann methods work for you, don’t forget to check out his Planetary Cycles, his Rare Writings, and his Ultimate Gann Course Coaching Online by David Bowden & Aaron Lynch. For courses that require a package membership, you can download them for free once you register for the package to get access to exclusive courses for 1 month, 3 months, and 12 months.
Application of Gann Trading Techniques
How to use Gann indicators is method studied on the basis of price and time theory.
- Price Research: You can follow and predict future stock price movements based on pivot levels. Stock prices can also be predicted by resistance and support levels.
- Learning time: Gann’s indicators give traders an idea of when a stock’s value might reverse. Traders can then easily analyze past data to determine the current stock price. Deeply understanding Gann’s theory of indicators, traders will develop the skill of estimating when stock prices will fall, which cuts risk significantly.
- Application in modeling research: Models are the key for investors to figure out the movements of stocks and the behavior of others. This method also helps predict trends and indicate reversals in stock movements.
>> Explore more: Gann’s course
What Is the Weakness And Strengths of Gann Indicators?
Gann angles have different meanings. 1X2 means the angle of movement of one price unit in every two-time unit. 1X1 is moving one unit price with one unit of time. Finally, 2X1 moves two price units with one unit of time. Using the same procedure, the Gann angles can also be 1X8, 1X4, 4X1, and 8X1.
The scale of the histogram is very important for forecasting techniques. If the scale is plotted incorrectly then the Gann angle will not work properly. This causes false predictions and is potentially risky for traders.
In addition to showing support and resistance indications, the Gann angle also provides clues about the strength of the trading market. Trading above the 1X1 angle in an uptrend means that the market is rising.
Based on the 2X1 angle, traders can also determine whether the market is in an uptrend or downtrend. Trading above or slightly above the 2X1 angle indicates a bullish market and vice versa. Trading at or near 1X2 means the trend is not strong. The strength of the market is reversed when looking at the market from the top. Anything below 1X1 is weak.
Example for How to Use Gann Indicators
Looking at the illustration the trader can determine the direction of the Gann angle. When the price crosses a corner, it will continue towards the next corner.
Gann indicators show the volatility of the market
The Weakness And Strengths
Gann angles have different meanings. 1X2 means the angle of movement of one price unit in every two-time unit. 1X1 is moving one unit price with one unit of time. Finally, 2X1 moves two price units with one unit of time. Using the same procedure, the Gann angles can also be 1X8, 1X4, 4X1, and 8X1.
The scale of the histogram is very important for forecasting techniques. If the scale is plotted incorrectly then the Gann angle will not work properly. This causes false predictions and is potentially risky for traders.
In addition to showing support and resistance indications, the Gann angle also provides clues about the strength of the trading market. Trading above the 1X1 angle in an uptrend means that the market is rising.
Based on the 2X1 angle, traders can also determine whether the market is in an uptrend or downtrend. Trading above or slightly above the 2X1 angle indicates a bullish market and vice versa. Trading at or near 1X2 means the trend is not strong. The strength of the market is reversed when looking at the market from the top. Anything below 1X1 is weak.
The Gann fan has been applied to the chart of the SPDR Dow Jones Industrial Average ETF (DIA). The first angles are drawn away from the late 2018 lows. 1:1 angles are drawn at 45 degrees. The uptrend moderately begins to respect the 3:1 angle.
The price then fell further. When the price falls, it will eventually break all the uptrend angles. At any point during the decline, the Gann angle can also be applied to a high price point, descending lower. 1:1 is again aligned with 45 degrees. An angle tool can be used to ensure that 1:1 is at 45 degrees.
The Bottom Line
Gann indicators are important technical analysis tools that traders use. They are used to set stop loss and target for trades based on LTP (last traded price). If used properly, Gann trading strategies using Gann indicators can lead to many successful trades. Gann’s theory is only successful when applied correctly. This requires time and experience.


