1. What is the Fibonacci retracement in trading and how does work?
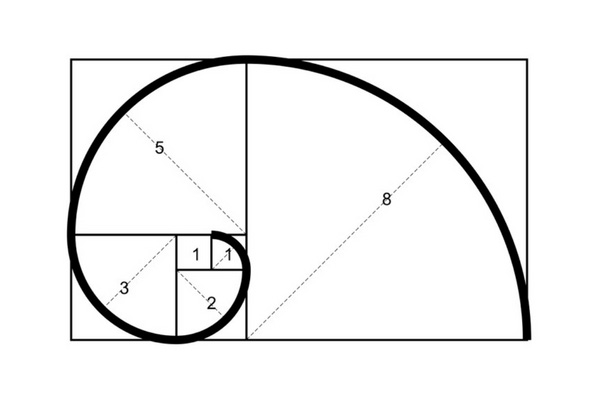
Fibonacci retracement levels (Fib retracement levels) is a technical analysis method used in finance to determine support and resistance levels. This powerful tool is named after a sequence of numbers produced by a famous mathematician Leonardo Pisano (1170-1250), aka Fibonacci. The Fibonacci sequence of numbers is described as follows: 0, 1, 1, 2, 3, 5, 8, 13, 21, 34, 55, 89, 144, 233, 377, 610…, in which each number is simply the sum of two preceding ones and hence the series is infinite. There are also other interesting facts about the Fibonacci sequence’s properties, however, we only dive deep into these topics in another article.
2. What are the Fibonacci ratios? The best Fibonacci retracement levels in trading
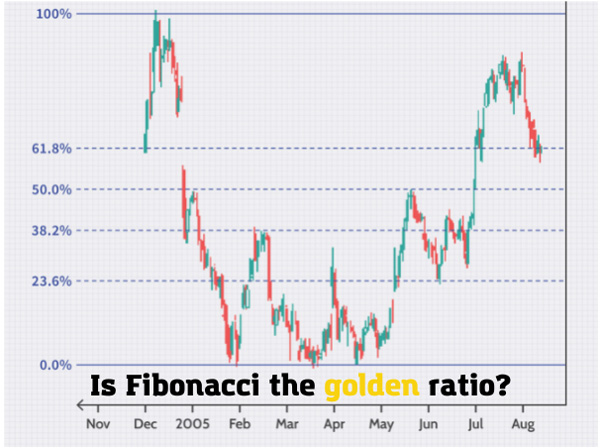
Fibonacci levels are horizontal lines on the trading chart that show where support and resistance are expected to occur. They link any two positions that the trader considers important, usually a high and a low point. The percentage levels given represent locations where the price might halt or reverse.
From the Fibonacci sequence as listed above, the following ratios are produced: 23.6%, 38.2%, 50%, 61.8%, 78.6%, 100%, 161.8%, 261.8%, and 423.6%. Despite the fact that 50% is not a Fibonacci ratio, it is nonetheless employed as a support and resistance signal.

Fibonacci retracement levels in technical analysis identify critical places where a stock may reverse or stall. Among the most common Fibonacci ratios are 23.6%, 38.2%, and 50%. These are often found between a security’s peak and low points, and are intended to forecast the future direction of its price movement.
3. Is Fibonacci the golden retracement ratio?
The ratios of Fibonacci numbers sequence identify price levels to which markets tend to retrace a portion of a move before continuing in the original direction. The important idea is that as the numbers increase in size, the quotient between each subsequent pair of Fibonacci numbers approaches 1.618, or its inverse, 0.618. This proportion is known by several terms, including the golden ratio, the golden mean, ϕ, the divine proportion to name a few.

From nature’s simplest building components, such as atoms, to the most complex patterns in the cosmos, such as impossibly enormous celestial bodies, there is a unique ratio that can be utilized to define the proportions of everything. Nature, and it appears that the financial markets employ this ratio to preserve equilibrium. Let’s look at some of the examples of Fibonacci golden ratio pocket in finance as below.

Fibonacci golden ratio in trading and investing
Traders and technical analysts regularly employ the golden ratio to anticipate market-driven price fluctuations. This is due to the psychological significance of the Fibonacci number series and the golden ratio in herd behavior. Traders are more inclined to grab gains or cover losses at specific price points denoted by the golden ratio.
Surprisingly, the widespread usage of the golden ratio in trading analysis creates a self-fulfilling prophecy: the more traders adopt Fibonacci-based trading methods, the more effective such strategies tend to be.
Technical analysis fibonacci retracement
In technical analysis fib retracement, the golden ratio is usually expressed as three percentages: 38.2%, 50%, and 61.8%. More multiples, such as 23.6%, 161.8%, 423%, and so on, can be employed as necessary. Meanwhile, the Fibonacci sequence may be applied to charts in four ways: retracements, arcs, fans, and time zones. However, depending on the charting application used, not all may be available. And in the scope of this post, we only look at Fib retracement in depth.
4. What do Fibonacci levels tell you?
As mentioned above, Fib retracements level can be used to create stop-loss levels, place entry orders, and set price goals. Following an upward movement, it retraces to the 61.8% level. Then it begins to rise again. The trader decides to purchase since the rebound happened at a Fibonacci level during an upswing. A stop loss might be put at the 61.8% level, since a return below that level could suggest that the rally has failed.
The Fibonacci retracement method is often used by technical traders to find critical locations for transactions, stop losses, or target prices in order to get in at a decent price. Many indicators, including Tirone levels, Gartley patterns, fib retracement Elliott Wave, and others, utilize the concept of retracement.
Unlike moving averages, Fibonacci retracement levels are unchangeable. The pricing levels’ unchanging nature enables for rapid and clear identification. This enables traders and investors to anticipate and respond appropriately when price levels are tested. These inflection points are where price movement, either a reversal or a break, is predicted.
5. How to use Fibonacci retracement indicator?
Fibonacci retracement lines are formed when the vertical distance between the high and low points is divided by the key Fibonacci ratios. On the trading chart, horizontal lines are drawn at the 23.6%, 38.2%, and 61.8% retracement levels. Some traders prefer to use a 50.0% ratio, which is not a Fibonacci ratio, but it is useful. A security will frequently retrace by 50% before resuming its original trend.
Drawing Fibonacci lines has become easier thanks to charting software. When there is an upward trend, you can use the Fibonacci line tool to select the low price and drag the cursor up to the high price. The indicator will highlight key ratios on the chart, such as 61.8%, 50.0%, and 38.2%. Apply the same procedure in a downward trend or you can also use double tops or double bottoms as high and low points to improve accuracy.
6. How to apply Fibonacci retracement levels in a trading chart?
You can utilize a Fibonacci retracement indicator to suggest where to initiate a trade, which is one of the most prevalent technical trading tactics. For example, suppose you observe that a stock has dropped 38.2% after experiencing tremendous momentum. You choose to enter the trade as the stock begins to rise in price. Because the stock has hit a Fibonacci level, you believe it is a good moment to purchase, with the trader anticipating that the company would subsequently retrace, or recoup, its recent losses.
7. What are the best Fibonacci trading strategy?
Fibonacci retracements are applied to a wide range of financial markets and on different periods like stocks, commodities, and forex.
Fib retracement lines are frequently utilized in trend trading strategies. If a trend is retracing, you might utilize Fibonacci levels to execute a trade in the direction of the underlying trend. The notion is that there is a better likelihood that a security’s price will bounce back in the direction of the initial trend after reaching the Fibonacci level.
Fib retracement levels can be handy when you want to purchase a certain investment but have missed out on a recent upswing. You could wait for a downturn in this circumstance, and can discover likely retracement levels and initiate prospective trading positions by charting Fibonacci ratios such as 61.8%, 38.2%, and 23.6% on a chart. However, if you want to more correctly detect market movements, improving your earning potential, making a combination with other technical analysis techniques as part of a larger plan is the best Fibonacci retracement levels strategy. In general, the more confirming variables there are, the stronger the trade signal.
Using Fibonacci extension

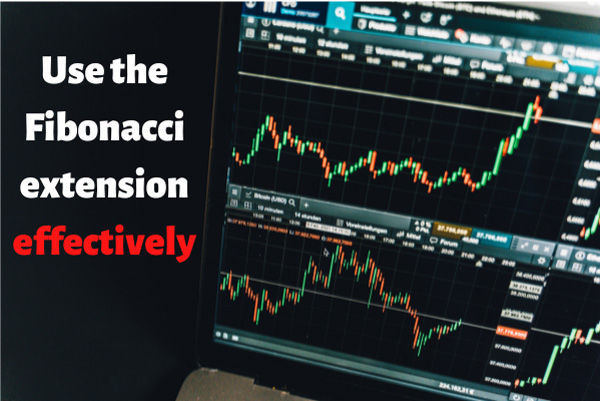
Using Fibonacci levels can predict future regions of support or resistance for traders to enter the market in the goal of capitalizing on the continuance of an original trend. Using Fibonacci extensions, on the other hand, can enhance this method by giving traders with Fibonacci-based profit goals. Fibonacci extensions are levels extended beyond the conventional 100% level (primarily 161.8%, 261.8%, and 423.6%) that traders can use to predict places with strong potential for their trades in the direction of the trend.
Differences between Fibonacci retracement vs extension
Fibonacci retracements apply percentages to a retreat, whereas Fib extensions apply percentages to a continuing rise. For example, a stock may rise from $5 to $10 before falling down to $7.50. The drop from $10 to $7.50 represents a retracement. If the price begins to rise again and reaches $16, this is an extension.
8. The drawbacks of using Fibonacci levels
While the retracement levels show where the price finds support or resistance, there is no guarantee that the price will stop there. This is why other confirmation indications, such as the price beginning to bounce off the level, are frequently employed.

Another argument against Fib retracement levels is that there are so many of them that price will frequently reverse around one of them. The issue is that traders are unsure which one will be beneficial at any given time. When it doesn’t work out, the trader should have looked at another Fib retracement level instead.
In conclusion
Fib retracements indicator are powerful tools for traders to find support and resistance levels. They can use the information acquired to make trades, define stop-loss, and create price goals. Fibonacci levels, while useful, should not be used in isolation. To create more accurate evaluations of trends and make better trading decisions, other trading indicators are also considered. Additionally, when paired with other non-correlated technical research, Fibonacci retracements can yield a high predictive value.


