

$59.00 $597.00
10X Bars Indicator 2022 – John Carter helps you rapidly assess a trend’s quality and strength without having to go through sophisticated calculations.
Course overview
10X Bars Indicator 2022 – John Carter shares with you the powerful weapon named 10x Bars Indicator that can be used as a confirmation to remain in a trending chart or as an early warning to exit a trending chart. With this course, you will be led through the process step by step in a pre-recorded video session, which enables you to get your new 10x Bars Indicator up and running quickly and easily.
This course is designed for Stocks Trading, Options Trading, Futures Trading, and Crypto Trading.
Course Outline
- 10x Indicator
- General Indicator Installation Guide for ThinkorSwim TOS
- How to Configure a Multi-Time Frame label study on TOS
- How to Download and Install Your Indicator
- Multi19xTOS
- Multi10x Study
What will you learn?
- How to identify 18 timeframes (long or short) quickly and easily.
- How to find intraday and swing setups.
- How to increase the probability that a stock will have a price expansion with multiple timeframes in play.
- Precise rules for entry and exit (including early signal detection)
- How to plot in the top left corner of your active chart and dynamically find setups across many timeframes.
Who is this course for?
This course is ideal for those who want to master their price action trading level for more steady profits.
Please Login/Register if you want to leave us some feedback to help us improve our services and products.
RELATED COURSES
VIEW ALL
-
 A Little Keltner, a Little Wycoff and of lot of Street Smarts – Linda RaschkeDOWNLOADA Little Keltner, a Little Wycoff and of lot of Street Smarts – Linda RaschkeUpdate 05 Dec 2022All LevelsDOWNLOAD
By altering the bands depending on the most recent average daily price range, the book will naturally be further away from the market when price fluctuations are large. They will, however, maintain a far more consistent breadth than Bollinger bands.
Add to wishlist -
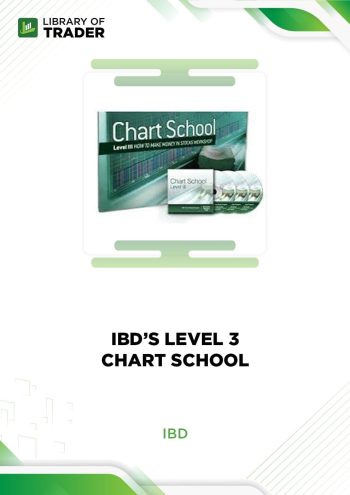 IBD’s Level 3 – Chart SchoolDOWNLOADIBD’s Level 3 – Chart SchoolUpdate 03 Nov 2022DOWNLOAD
The IBD’s Level 3 course by Chart School (or The IBD Chart School) is jam-packed with lessons on how to improve positions, identify IPOs poised to break out, and comprehend charts at a deeper level.
Add to wishlist -
 Balance Dynamics Video Course – Michael ParsonsDOWNLOADBalance Dynamics Video Course – Michael ParsonsUpdate 04 Nov 2022All LevelsDOWNLOAD
Balance Dynamics Video Course by Michael Parsons provides a highly visual tool that is every trader’s dream, based on a geometric wave principle.
Add to wishlist -
 Trading the News Seminar – Tom YeomansTrading the News Seminar – Tom YeomansUpdate 11 Nov 2022All Levels
Trading the News Seminar – Tom Yeomans teaches you how to trade economic news events, mostly using fundamental news event data and currency strength measurements to guide your trading decisions.
Add to wishlist -
 Technical Analysis Signal – Option AlphaDOWNLOADTechnical Analysis Signal – Option AlphaUpdate 26 Nov 2022All LevelsDOWNLOAD
Technical Analysis Signal by Option Alpha sheds light on technical analysis and effective tools to develop viable strategies for consistent profits and low risks. The supporting roles of powerful tools ease the trading process but generate higher profits.
Add to wishlist -
 Using Point and Figure Charts to Analyze Markets – Tom DorseyDOWNLOADUsing Point and Figure Charts to Analyze Markets – Tom DorseyUpdate 17 Nov 2022All LevelsDOWNLOAD
Using Point and Figure Charts to Analyze Markets – Tom Dorsey offers an up-to-date look at point and figure charting from one of the foremost authorities in the field.
Add to wishlist


Reviews
There are no reviews yet.