Introduction
What defines the differences between a successful trader and an average one? In the modern world, everybody has easy access to basic knowledge and essential information via countless learning platforms all across the internet, both free and premium. Despite such a situation, It is clear that your success is not reflected by the amount of knowledge that is given to you, but by how you can acquire useful insights and know how to analyze the current market situation to apply what you have learned to the trading process.
The real amount of data coming from all the markets is just way beyond the ability of an individual for him to handle. You cannot just mindlessly stare at the screens trying to make sense of movements from a certain market. You have better work to do. That is the reason why prosperous professionals always utilize the help of analysis techniques – especially order flow trading – to save their precious time and enhance their trading system. Let’s deep dive into the technique and see what it has to offer to potential traders.
1. What is Order Flow Trading?
Order flow in trading (also referred to as tape reading) is one sort of trading analysis method and is among the popular choices preferred by professionals on the market, including technical analysis, sentimental analysis, and fundamental analysis.
The process of order flow in trading involves analyzing and acquiring insights from the number of transactions recorded via the order book or footprint charts and made by other traders in a certain market. This analysis method enables the users to take a closer look at the information regarding the orders and trades that are placed during a specific period. For instance, traders can see the amount of both buy and sell orders at a given point in time, and their subsequent impact on the market movements.

Order flow trading is also regarded as a volume-based trading system that can reach the most detailed information by studying candlesticks. The study often revolves around recent buy and sell execution, making strategies that based on this type of analysis method are more likely to be used on short-term plans.
2. What Does Order Flow Trading Show You?
Different trading platforms such as NinjaTrader, MetaTrader, or AmiBroker offer different sets of tools for order flow trading. They may not be so distinctive from each other, but every individual possesses certain additional features to attract users to the related trading platforms. Although the features and details shown may vary, there are certain categories shared by all as the following:
- Significant buy/sell executed orders
- The people who take part in the trade, including sellers and buyers
- The volumes of the orders
- The volume point of control (VPOC): the highest traded point of the volume in the candle
- The size of orders
- Limit orders
- Depth of market (DOM)
Insights from order flow analysis cover both the volume of executed orders at a given time as well as the number of orders waiting to be carried out over a broad range of price points. This is somewhat similar to what is shown on candlestick charts. With the help of order books and footprint charts, order flow trading enables you to see even further toward micro price movements, including limit orders and market orders being executed.
Executed market orders are the primary focus in footprint charts. With them, users can easily find out the number of participating buyers and sellers as well as limit orders. These are price levels that have to meet the current market price so that trade orders can be properly carried out. The involved orders in their ‘waiting’ status will only be available for viewing via order books, not candlestick charts. When the waiting process is eventually done, they will be normally displayed on the official charts just as other market orders.
Users of order flow trading analysis can also identify the support and resistance levels thanks to the determined size of buy and sell orders, or the imbalances between the buy and sell volume shown on footprint charts. An imbalance indicates the type of traders that outnumber the other at the time and, in turn, which potential price levels can be formed. For instance, an imbalance where the number of buyers outshines that of buyers indicates the potential support levels and vice versa.
3. The Depth of Market (DOM) and its Connection With the Order Type
The depth of market (or DOM for short) shows the significant amount of buy and sell orders of a chosen financial asset. Great market depth with higher volume means better liquidity and chances for more accurate price movement prediction. If the liquidity is consistently high, one single trade cannot easily make a remarkable impact on the market price, thus making it negligible so that the traders can focus on other causes during their analysis and study of changes in the market movements.
In a volatile financial market with lower liquidity, limit order levels are often a distance away from the price of the market. If the limit order values do not meet the current market price, the involved orders will obviously not get executed. In such a situation, the DOM portrayed by these values may pose a false overview of the market to make the right decisions. However, traders do not need to worry about the same case in a market with higher liquidity as the limit orders will be more reliable and move closer to the market price.
Traders tackling illiquid assets often utilize observing via market orders for the convenience of executing trades immediately and leave limit order values for further analysis regarding the current behaviors of other traders.
4. How to Read an Order Flow Trading Analysis
Before you get to know how to use order flow trading, you must first understand some of the following terms. An order flow trading analysis usually involves order books, other tools such as footprint charts, and even candlestick charts thanks to its relevant information and the shared aspects between order flow trading analysis and technical analysis.
Footprint charts at first glance are like the in-depth version of candlestick charts. It is one of the most common tools of order flow trading analysis and only shows executed orders. The information from a certain period contains multiple candlesticks alongside the details of orders, as below:
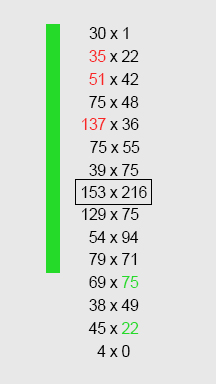
The colored bars are the candlesticks. The details regarding a single candlestick are portrayed as rows of numbers, which are then divided into two smaller columns. These smaller columns are separated by an ‘X’ or ‘|’. The number column on the left represents the amount of executed sell orders while the right one indicates that of executed buy orders. If the numbers are colored in either green or red, they signal acts of aggressive buying and selling, respectively.
5. What Does a Candlestick Tell You?
Let’s take a closer look at a candlestick to see what it has to offer.

The first row in this candlestick says ‘30 x 1’, meaning that at that certain price level, there are 36 sell offers and 1 buy offer that are fulfilled.
The last row in the demonstration indicates that only 4 available sell offers are filled. Now, look at the row right above it, we can see there are 22 buy offers executed and colored in green. Because the 22 buy offers are way more than the 4 sell and 0 buy offers below, indicating a higher buying pressure, hence the reason why it is marked in green.
Now, let’s focus on the first two rows of the candlestick display to understand more about the numbers in red. Comparing 30 sell offers in the second row to 1 buy offer in the first row, we see that there is only one bid at the highest price point of the candlestick. However, there are 22 buy offers at the price level right below, suggesting that there is an expectation for aggressively selling.
At the center of the candlestick, we can see a row covered by a box which is known as the volume point of control (or VPOC for short) where the trading volume reaches its max potential. At this point, there are 153 sell offers and 216 buy offers that get filled, higher than any other row in the candlestick.
Newer versions of trading platforms allow you to make adjustments to the user interface for enhancing your trading experience even better. For instance, you can config the colored numbers indicating aggressive buying or selling to be degree-sensitive. That means the color will be in a much darker shade if the pressure is high and vice versa.
6. How to Make an Entry With Order Flow Trading Analysis
The order flow trading strategy is primarily used to detect patterns so that we can make further profitable decisions. The tools of order flow trading analysis should be used alongside other essential tools and methods – for instance, technical analysis – to make your predictions more certain. The chart below will show how a footprint chart can help you make a profitable entry.

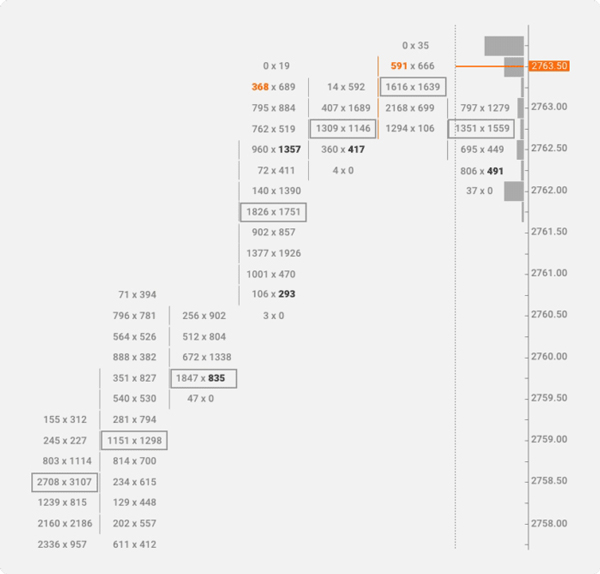
We can see right away that there are multiple cases at the lowest price points of the candlesticks where no buyer is willing to make their entries and no sell offer is filled. However, right above these instances, the interest from buyers significantly rises as the numbers of both sale and buy offers get filled are way more than price points below them. Additionally, we can easily see the volume points of control consistently occur at higher price levels for each order flow entry. This hints at a possibility of a strong upward trend where you should immediately place a buy offer for profit.
The same logical deduction can also be made using the same process where a downtrend is expected. In such a situation, there is no buy offer at the highest price value of the candlestick. As we go down the rows below, there will be signs indicating that the interest from buyers only increases as the price goes lower. The VPOC will also consistently occur at diminishing values. If you happen to identify these signs during your analysis, you should consider selling to realize any possible profit.
This type of chart can also be used for predicting trend reversals by utilizing the information from order flow trading analysis and the relevant resistance and support levels detected. Other analysis techniques and methods should always be at your disposal to determine whether the signals from your order flow trading analysis are strong or not.
In Conclusion
Any analysis method may pose a tough obstacle to traders with no prior knowledge because of its technical-driven nature. But once you get the hang of it, you will soon see the reasons behind the success and fortune of professional traders as well as why countless numbers of traders still try their best daily to overcome challenges. The institutional order flow trading of forex factory is highly recommended to see real trading cases.
Hope this article has given you a thorough understanding and well-covered overview of order flow trading analysis. Stay tuned for more to come.


