Trading market internals is a series of indicators that traders can use to see where the market is headed. All indices measure money entering or leaving the NYSE or Nasdaq markets.
What Is the Stock Market?
The stock market is where buyers and sellers exchange shares of holding companies. Financial operations are performed. The market allows to determine the stock prices of corporations and serves as a barometer for the overall economy. Buyers and sellers are assured of fair prices, high levels of liquidity, and transparency as market participants compete in the open market.
What Are Trading Market Internals?
Trading market internals is a group of indicators that traders use to measure and calculate market trends. The New York Stock Exchange (NYSE) and Nasdaq will do this in a variety of ways. Traders/investors are voting with their dollars.
If more cash outflows indicate that selling is overwhelming buying, you can expect the market price to fall. Conversely, if more money flows in, the number of buyers increases more than sellers, and the market price is likely to rise again.
These internals can often act as leading indicators, as you can see what the insides of the market engine are doing in real-time.
How Trading in Stock Market Work?
Companies raise money in the stock market by selling ownership shares to investors. This equity share is known as a share of stock. By listing shares for sale on the stock exchanges that make up the stock market, companies can access the capital needed to operate and expand their business without incurring debt. In exchange for the privilege of selling shares to the public, companies must disclose information and let shareholders know about how their business is run.
Investors benefit by exchanging their money for shares in the stock market. As companies put that money aside to grow and expand their businesses, investors reap the benefits as their shares become more valuable over time, resulting in capital gains. In addition, companies pay dividends to their shareholders when their profits increase.
The performance of individual stocks varies greatly over time, but the stock market as a whole has historically rewarded investors with an average annual return of about 10%, making it one of the most reliable ways to increase your money.
How Are Prices Determined on a Stock Market?
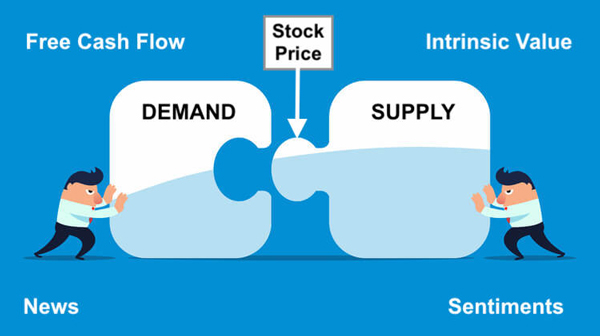
Stocks are part of an actual business. After being listed, the company’s shares will start trading on the stock exchange. The better the business, the better the stock will be. Stock prices are controlled by demand and supply. More supply than demand will cause prices to fall. If the company’s destructive potential leads to many people selling shares, the stock price will decrease.
The trading of the stock market is similar to other markets. When a stock is sold. When a stock is sold, the buyer and seller exchange money to own the shares. The price at which purchased the stock becomes the new market price. When a second share is sold, this price becomes the latest market price.
Warren Buffett argues that the value of a stock is equal to the discounted value of the cash flows it earns over the life of the business. We can value a business by estimating how much income the business can generate in the future. Then calculate the slippage of money because the present amount’s value is higher than its future price.
There are specific quantitative techniques and formulas that make it possible for traders to predict the stock value of any business. The dividend discount model (DDM) determines a company’s stock by the sum of its expected future dividends.
The Benefits of Reviewing Trading Market Internals
Trading market internals provide traders with an overview of market activities. You can take advantage of trading market internals to find out if the trading volume on NASDAQ is above average or whether the value of a stock is rising or falling rather than simply knowing how much NASDAQ is up or down.
Trading market internals allows traders to see how well this market is performing compared to others by going beyond the indicators. For example, you can look at the ratio of gains to losses on the NASDAQ and compare it to the same ratio on the NYSE or AMEX.
It’s easier to look at market-cap indexes like the S&P 500 when looking at the number of advancers and losers. If the S&P 500 is up 2%, it could be because all the stocks in the index are up 2%. Or it could be because Apple, Facebook, and Amazon are all up 5%, while most of the stocks in the index are actually down 2% on the day.
Market volume data is also very useful for reviewing and analyzing liquidity. In addition to seeing activities that are particularly lively or particularly quiet, you can also see if they are driven by small or high-value transactions.
How to Invest in Shares
Type You Want to Invest
There are several ways for you to choose your investment. So you need to consider which investment style you are suitable for. Do you want to spend more or less time in this area, etc? This is your first important decision point: How will your money be managed?
- A human professional: A great option for those who want to spend just a few minutes a year worrying about investing. This is also a good option for those with limited investment knowledge.
- A robo-advisor: This is an automated way of managing your money using the same decision process that a human advisor can do but at a much lower cost. You can set up an investment plan quickly and then all you need to do is make a deposit and the robot advisor will do the rest.
- Self-managed: People with better knowledge or those who can take the time to make investment decisions
Find the Difference Between Investing in Funds and Stocks
- Stock mutual funds are also called exchange-traded funds. Mutual funds allow you to buy fractions of many different stocks in a single transaction. Index funds and ETFs are a type of mutual fund that tracks an index.
For example, the Standard & Poor’s 500 fund copies that index by buying shares of the companies in it. When you invest in a fund, you also possess small pieces of each of those companies. You can pool multiple funds together to build a diversified portfolio. You should take notice of stock mutual funds also sometimes called equity mutual funds.
- Individual Stocks: If you are researching and want to invest in a particular company, you can build your portfolio with considerable research. However, think about why you
Mutual funds are not likely to grow as measuredly as some individual stocks. For individual stocks, if you choose wisely, you can achieve very high returns and make yourself rich extremely quickly.
Make the Right Budget
The amount needed to invest can be more or less depending on your goals. However, you should not spend all your money on investing because it is very risky.
You can allocate a sizable portion of your portfolio to stock funds, especially if you have a long time horizon. A 30-year-old investing for retirement can have 80% of their portfolio in a stock fund; the rest will be in the bond fund.
Also, how much you invest in stock depends on how expensive it is. Stock prices can range from a few dollars to several thousand dollars.
Manage Your Portfolio
If you follow the steps above to purchase mutual funds and individual stocks over time, you’ll want to review your portfolio a few times per year to make sure it’s still relevant to your investment goals. you’re private.
If your portfolio is too focused on one industry, reevaluate and allocate your capital to another area. This creates variety in the portfolio. In addition, stock prices tend to fluctuate by industry. If you focus on only one area, the risk is very large.
You also should focus on geographic diversification. Vanguard recommends international stocks make up 40% of the stocks in your portfolio. You can purchase international stock mutual funds to reach this exposure.
What Is the Function of the Stock Market?
The stock market ensures price transparency and liquidity of transactions. All market participants have access to data on buy and sell orders. The stock market also ensures efficient matching of buy and sell orders.
Qualified traders can immediately place orders and the market ensures orders are filled at a fair price.
Traders in the stock market include market makers, investors, traders, speculators, and hedgers. An investor can buy stocks and hold them for long periods of time, while a trader can enter and exit a position within seconds. A market maker provides the necessary liquidity in the market, while an underwriter can trade derivatives.
What Does Stock Market Volatility Mean?
Finance market volatility is the speed and frequency with which the price of a stock rises or falls. The higher volatility, the greater risk.
If the price of a stock fluctuates rapidly in a short time, hitting new highs and lows, it is said to have high volatility. If a stock’s price rises or falls more slowly, or remains relatively stable, it is said to have low volatility.
Factors driving stock price volatility:
- Economic and political influence
- Industry and sector factors
- Business results
- Relevant news from industry influencers
Trading Market Internals Indicators and What They Mean
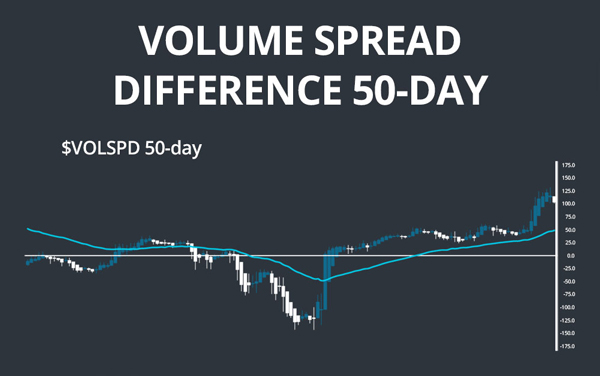
Volume Spread Difference
The Volume Spread Index shows the difference between the volume of advancing stocks and falling stocks during the day. This indicator is basically made up of two codes, $UVOL, and $DVOL. It is useful on two timeframes: the daily chart to see trends over the past few days and the short-term intraday chart to see where volume is moving in the next hour.
Traders can easily plot short-term moving averages such as 10 days and zero lines. If the moving average is above the zero line, the volume of stocks usually falls on stocks that have gained a lot of price within a few days.
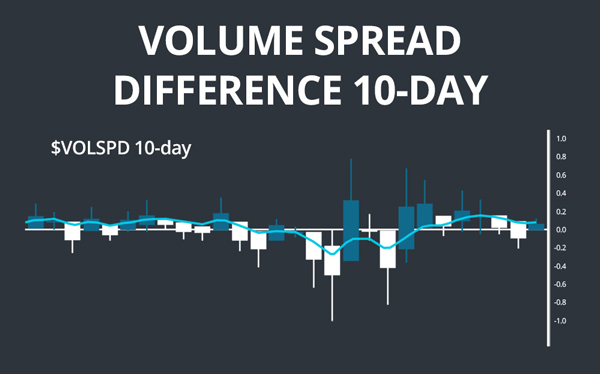
If the moving average is longer, there are more applications to give you more perspective on the day’s broad trend.
NYSE TICK
The NYSE $TICK Index is applicable for a very short time frame. This is the last beat of the market on a second-by-second basis. The $TICK measures on many of the stocks on the NYSE at that moment were bullish versus bearish.
The use of the $TICK indicator to identify extreme moments in the market and deal with them. However, you should also be careful when handling these cases. When the markets are in strong trends, try to blur them like you are trying to catch a falling knife.
On the other hand, in volatile markets, fading extremes can be a potentially lucrative opportunity to take profits.
Once a trader has identified a time when the market is trending strongly, he or she will use the high $TICK indicators as a confirmation indicator, rather than a trading divergence. Some extreme levels to note:
- 800
- 1000
- 1400
Advance Decline Difference ($ADD)
The pre-discount ratio indicates the difference between a bullish and a bearish stock. It leads to positive and negative results. A -500 index means that there are 500 more stocks that are down from the day’s growth.
The Advance-Decline Difference measures the overall strength of the stock market. Apple and Microsoft account for about 7% of the S&P 500, and if those two stocks rise while the rest trade in a tight range, the S&P is likely to rise on the day. Some stocks are disproportionately weighted in prolonged rallies that can make the market look stronger than it really is if the rest of the stocks don’t follow suit.
This is where the Pre-Reduction Rate comes in. It measures confirmation of positive (or negative) action in the market or a divergence between the two.
The S&P 500 Volatility Index (the VIX)
The VIX is known to most traders and investors as the “fear index”. Essentially, VIX forecasts expected volatility over the next 30 days, on a yearly basis. The VIX is historically negatively correlated with the S&P 500.
The first concerns the VIX which acts as a leading indicator in the market. Basically use it for convergence or divergence. When the VIX spikes, the S&P is likely to follow with a sharp drop. Combining this with your other trading analysis will definitely improve your results.
The next effective use of VIX is to take advantage of it which means reverting to the essence. If you’re familiar with options trading, one of the core tenants of premium sellers is overstated implied volatility.
When implied volatility is high, it’s time to sell, as they’re built into that high price, in other words, it’s a positive longevity bet. Since the VIX is simply a measure of the implied volatility of the SPX, one can use these volatility trends on the VIX.
The Bottom Line
Market breadth indicators have become increasingly useful as big Tech stocks have dominated, in which the top 10 components of the S&P 500 index account for more than 20% of the index. It is important to use tools such as market insiders to keep track of how the rest of the markets are doing. You should also consult a financial professional for the most up-to-date information and trends. Check out more of our useful blogs because it’s free to learn trading.

