

By using technical indicators when analyzing stock charts in the Trading Room Video Course, you will be able to find the best entry/exit points, and identify the most profitable trading opportunities!


Course Overview
The almost 10-hour long video covers all aspects of trading – psychology, tactics, money management, record-keeping, all illustrated with a multitude of charting examples. It follows the book Come Into My Trading Room in its broad outline, but in many parts goes much farther and deeper, in response to campers’ questions.
Course Outline
- Reviewing the key stock market indices
- Bullish divergence
- Amazd histogram
- Envelope
- Nasty bear
- False Breakout
- Chart
- Spike trade
- Gold
- Jeff
What Will You Learn?
- Discover how to analyze stocks with candlestick charts to perform technical analysis
- Strategically trade the stock market with over 20+ technical indicators
- Learn to identify trend reversals, overbought / oversold levels and divergences
- Analyze stocks with indicators such as the MACD, RSI, moving averages and more!
Who Is This Course For?
- Beginners looking looking to learn technical analysis strategies for stock trading
- Technical traders looking to implement new strategies for trading the stock market
- Fundamental traders looking to learn how to trade stocks with technical analysis
Alexander Elder
Please Login/Register if you want to leave us some feedback to help us improve our services and products.
RELATED COURSES
VIEW ALL
-
 AmiBroker Introductory and Advanced Courses – Trading MarketsDOWNLOADAmiBroker Introductory and Advanced Courses – Trading MarketsUpdate 10 Nov 2022All LevelsDOWNLOAD
AmiBroker Introductory and Advanced Courses – Trading Markets teaches you how to backtest your best trading ideas in one day. You can start the course with minimal to no knowledge on how to backtest in AmiBroker.
Add to wishlist -
 Robotic Trading – ClayTraderDOWNLOADRobotic Trading – ClayTraderUpdate 07 Nov 2022AdvancedDOWNLOAD
This course approaches technical analysis from the fundamentals to advanced concepts. There are various aspects shown through real case studies. So, you can decode the volatile price actions!
Add to wishlist -
 Using Point and Figure Charts to Analyze Markets – Tom DorseyDOWNLOADUsing Point and Figure Charts to Analyze Markets – Tom DorseyUpdate 17 Nov 2022All LevelsDOWNLOAD
Using Point and Figure Charts to Analyze Markets – Tom Dorsey offers an up-to-date look at point and figure charting from one of the foremost authorities in the field.
Add to wishlist -
 Symmetry: The Power Tool – Simpler TradingDOWNLOADSymmetry: The Power Tool – Simpler TradingUpdate 09 Nov 2022All LevelsDOWNLOAD
Symmetry: The Power Tool by Simpler Trading shows the tools as well as strategies for the more accurate project of market movements.
Add to wishlist -
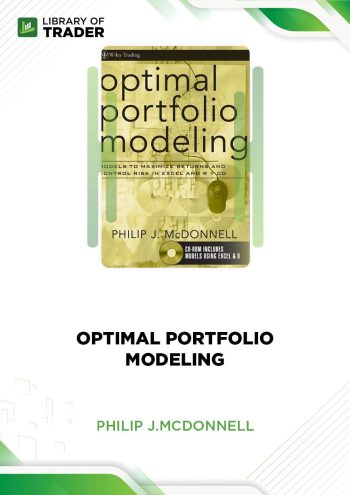 Optimal Portfolio Modeling: Models to Maximize Returns and Control Risk in Excel and R – Philip McDonnellDOWNLOADOptimal Portfolio Modeling: Models to Maximize Returns and Control Risk in Excel and R – Philip McDonnellUpdate 06 Nov 2022AdvancedDOWNLOAD
Optimal Portfolio Modeling by Philip McDonnell teaches you to harness the power of Excel and R to push your trading portfolio to the limits.
Add to wishlist -
 The Winning Secret Training – Peter SchultzDOWNLOADThe Winning Secret Training – Peter SchultzUpdate 06 Nov 2022All LevelsDOWNLOAD
This course takes the fear out of trading options and replaces it with knowledge, skills, confidence, and a strong mathematical likelihood of winning consistently and generously.
Add to wishlist


Reviews
There are no reviews yet.