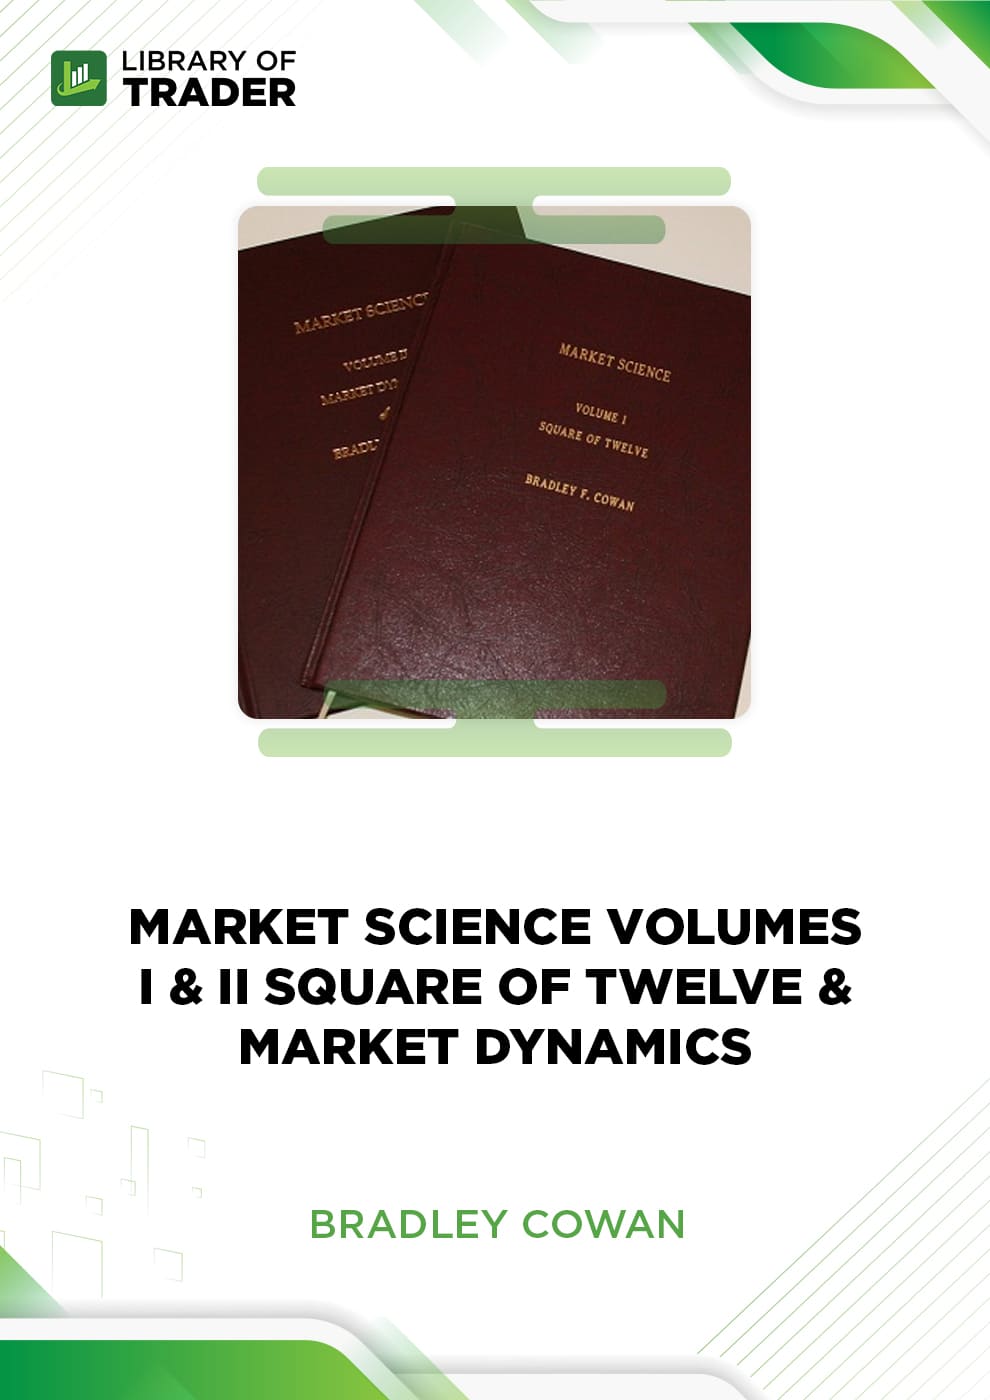
The content of Market Science Volumes I & II Square of Twelve & Market Dynamics is intended to illustrate novel and accurate market modeling methodologies. Hence, traders can learn how to forecast future market cycles after reading these materials.
Course overview
The third and fourth books in the course, Market Science Volumes I & II Square of Twelve & Market Dynamics, continue the discussion of Four Dimensional Stock Market Structures & Cycles.
- Market Science – Volume I – Square of Twelve is the third book in the series that builds on the content taught in Four Dimensional Stock Market Structures & Cycles by applying nonlinear approaches to commodities markets. The content of these publications is intended to illustrate novel and accurate market modeling methodologies that have never previously been made available to the general public.
- Market Science – Volume II – Market Dynamics is the fourth volume in this one-of-a-kind series, and it is widely regarded as one of the most useful sources of market knowledge ever produced. A remark like this is not made lightly since concrete facts are required to back it up. Market Dynamics performs something no one has ever done before, anywhere, at any time. It gives a model based on a simple numerical series that defines every key price-time turning point. This model’s resolution is found to be within two cent-days of the historical record of soybeans beginning in 1913.
Course outline
The detail content of the Market Science Volumes I & II Square course includes the following modules:
- Market Science – Volume I – Square of Twelve:
- Lesson XI – Square of Twelve:
-
-
-
- Readers who have completed Lesson I of Four-Dimensional Stock Market Structures And Cycles understand that the stock market operates within the boundaries of a fundamental unit of measurement.
- Market Science – Square Of Twelve clearly reveals that the square of twelve defines the fundamental building component of the soybean market. A careful investigation of this market since data was first gathered in 1913 provides proof.
-
-
- Lesson XII – Vectorial Partitioning:
-
-
-
- This lesson demonstrates how Isaac Newton’s First Law Of Motion, often known as “Galileo’s Law Of Inertia,” may be applied to financial markets where price-time changes can be viewed as points of force in motion.
-
-
- Market Science – Volume II – Square of Twelve:
- Lesson XIII – Non-Euclidean Price-Time Geometry:
-
-
-
- This lecture delves into the curvilinear geometric patterns that emerge in financial markets, using examples from SOYBEANS, LIVE CATTLE, AND THE STOCK MARKET. Price-Time Vectors form ellipses as they revolve around a point. As these ellipses spin around an axis, they sweep out the torus, which defines the price-time action containment boundary.
-
-
- Lesson XIV – Quantum Energy Levels of Freely Traded Markets:
-
-
-
- This lesson isolates and identifies the dominating number series defining the evolution of growth spirals in the soybean market, and demonstrates that the natural rule guiding this progression is the same one used to describe the fundamental element of matter, i.e., the structure of the atom. Readers will know this as the s, p, d, and f energy levels from high school chemistry. When market changes in both price and time can be reliably represented by a number series, future magnitude estimates become mechanical.
-
-
- Lesson XV – Soybean Cycles:
-
-
-
- Using the most comprehensive historical data available, this course analyzes and verifies the primary cycles in soybeans. The locations of these cycles are presented, along with forecasts of future turning points. Anyone actively trading in this market who is unaware of the locations of these cycles is setting himself up for financial catastrophe.
-
-
- Lesson XVI – Square of Fifty-Two:
-
-
- One of the most important cycles in many commodities, including soybeans, is the square of 52. One-fourth of this square represents the 13-year cycle that defined movements such as the 1973-1986 bear market. This square’s planetary connection is proven.
-
What will you learn?
The Market Science Volumes I & II Square course will enable you to achieve these significant values:
- Discover how to forecast future market cycles.
- Update on the trend stock market cycle and growth spiral
- Musical fifth applications in financial market timing
- Ancient temple dimensions and soybean growth spirals
Who is this course for?
The Market Science Volumes I & II Square course is suited for:
- Those who want to learn more about trading market movements.
- Those who want to improve their skills predict when the trend’s direction will shift.
- Those who want to better understand the distinct and precise market modeling methodologies.
Bradley Cowan
Please Login/Register if you want to leave us some feedback to help us improve our services and products.
RELATED COURSES
VIEW ALL-
 Safety in the Market Smarter Starter Pack 1st Edition – David BowdenDOWNLOADSafety in the Market Smarter Starter Pack 1st Edition – David BowdenUpdate 06 Nov 2022BeginnerDOWNLOAD
Safety in the Market Smarter Starter Pack 1st Edition gets your trading career on the launchpad by laying a solid foundation for understanding all the markets.
Add to wishlist -
 Trade the Trend – Gary DaytonDOWNLOADTrade the Trend – Gary DaytonUpdate 01 Nov 2022All LevelsDOWNLOAD
Trade the Trend – Gary Dayton teaches you how to clearly see the market early in the trend, to know where to enter, and to know where to take profit. The best profits lie in a trending market. This course helps you steadily earn them.
Add to wishlist -
 Tim Tactics – Timothy SykesDOWNLOADTim Tactics – Timothy SykesUpdate 16 Nov 2022All LevelsDOWNLOAD
Tim Tactics – Timothy Sykes reveals the most-used trading tips and tactics that have made him one of the biggest names in the world of penny stocks.
Add to wishlist -
 Trading Chaos (1st & 2nd Edition) – Bill WilliamsDOWNLOADTrading Chaos (1st & 2nd Edition) – Bill WilliamsUpdate 27 Dec 2022All LevelsDOWNLOAD
Its distinct organizational structure takes readers through the financial applications of chaos in five graded levels. Trading Chaos delves into human and economic behavior in ways that other works do not, including an investigation of the market’s basic structure.
Add to wishlist -
 Wyckoff Analysis Series. Module 1. Wyckoff Volume Analysis – Todd KruegerDOWNLOADWyckoff Analysis Series. Module 1. Wyckoff Volume Analysis – Todd KruegerUpdate 17 Nov 2022All LevelsDOWNLOAD
Wyckoff Analysis Series. Module 1. Wyckoff Volume Analysis – Todd Krueger exposes the market tactics and maneuvers used by smart money traders to consistently hoodwink the uninformed trader from their money.
Add to wishlist -
 Spikeability – Timothy SykesDOWNLOADSpikeability – Timothy SykesUpdate 02 Dec 2022All LevelsDOWNLOAD
The Spikeability by Timothy Sykes walks you through the tried-and-true strategies that brought him millions of dollars in his stock trading account. There are detailed guides and illustrated case studies for a better understanding of the frameworks.
Add to wishlist


Reviews
There are no reviews yet.