The Bollinger Bands Swing Trading System 2004 by Larry Connors shares instructions on applying this trading system to your trading. The best practices are under the spotlight to get the best out of it!
Course Overview
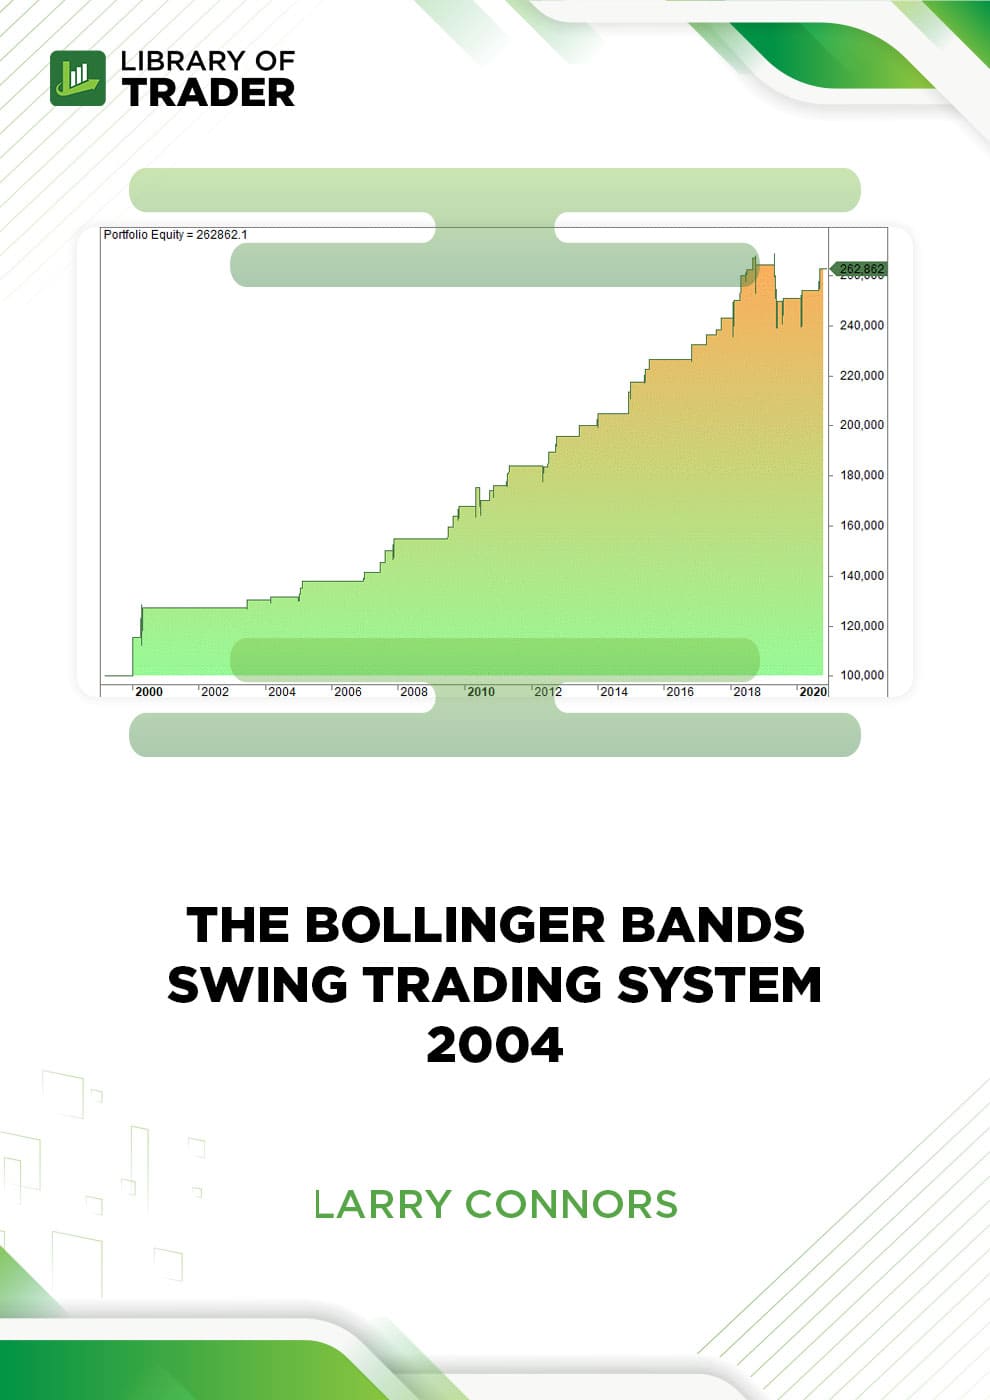
The Bollinger Bands Swing Trading System by Larry Connors spots reversals that occur when the market gets overbought or oversold. Typically, a stock that has 7-point swings within 10 days is more volatile than a stock that only has 2-point swings in 10 days.
The way that the Bollinger Bands stands out apart from other systems is that it takes into account the constant change of market volatility. So, the way it works is more relative to the way the market trends take place.
Course Outline
- Instructions on swing trading.
- Guideline on using the Bollinger Bands Swing Trading System.
- Real trading charts and case studies.
What Will You Learn?
- Better performance of swing trading through the support of swing trading tools.
- In-depth analysis of market trend patterns for more accurate market forecasting.
- How to transform insights into market trends into viable tactics and strategies.
- Building up your trading confidence.
Who Is This Course For?
The Bollinger Bands Swing Trading System by Larry Connors is for every swing trader no matter how long they have traded.
Larry Connors
Please Login/Register if you want to leave us some feedback to help us improve our services and products.
RELATED COURSES
VIEW ALL-
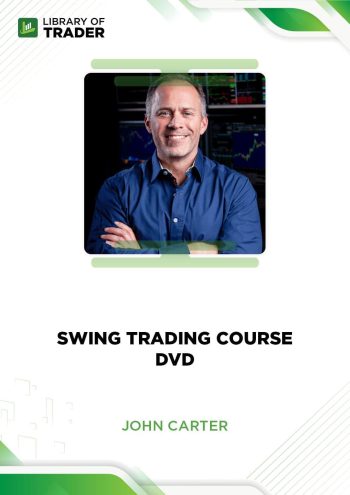 John Carter – Swing Trading Course DVDDOWNLOADJohn Carter – Swing Trading Course DVDUpdate 07 Nov 2022BeginnerDOWNLOAD
Swing Trading Course DVD by John Carter covers everything you need to know throughout all ups and downs of your swing trades.
Add to wishlist -
 Top Dog Courses 1 & 2 Foundations Bundle – Top Dog TradingDOWNLOADTop Dog Courses 1 & 2 Foundations Bundle – Top Dog TradingUpdate 01 Nov 2022All LevelsDOWNLOAD
Top Dog Courses 1 & 2 Foundations Bundle is the combination of Course 1: Cycles and Trends and Course 2: Momentum as a Leading Indicator. It is the foundation for all other courses offered by the platform.
Add to wishlist -
 Swing Trading College 2013 – 10-Weekly SessionsDOWNLOADSwing Trading College 2013 – 10-Weekly SessionsUpdate 14 Nov 2022All LevelsDOWNLOAD
Swing Trading College 2013: 10-Weekly Sessions focuses on swing trading techniques and strategies to achieve profits from carefully-planned swing trades without a lack of flexibility to the market status.
Add to wishlist -
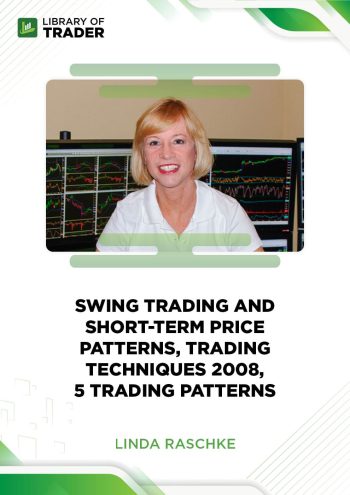 Swing Trading and Short-Term Price Patterns, Trading Techniques 2008, 5 Trading Patterns – Linda RaschkeDOWNLOADSwing Trading and Short-Term Price Patterns, Trading Techniques 2008, 5 Trading Patterns – Linda RaschkeUpdate 15 Nov 2022All LevelsDOWNLOAD
Swing Trading and Short-Term Price Patterns, Trading Techniques 2008, 5 Trading Patterns by Linda Raschke walks you through swing trading strategies and techniques for maximal profits and minimal risks.
Add to wishlist -
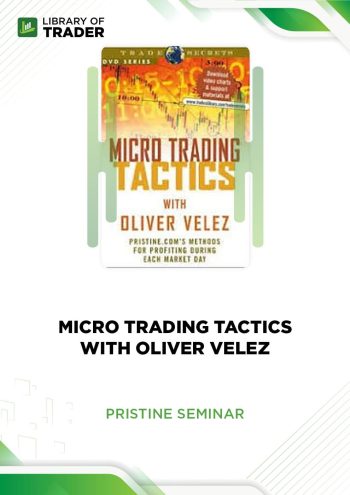 Micro Trading Tactics with Oliver Velez – Pristine SeminarDOWNLOADMicro Trading Tactics with Oliver Velez – Pristine SeminarUpdate 06 Nov 2022IntermediateDOWNLOAD
This course provides five powerful tactics to help you find profits in today’s volatile markets. With this course, you will be able to earn steady profits out of the market on a daily basis.
Add to wishlist -
 Trading Dave Landry’s Ultimate Bow Ties Strategy – Dave LandryDOWNLOADTrading Dave Landry’s Ultimate Bow Ties Strategy – Dave LandryUpdate 15 Nov 2022IntermediateDOWNLOAD
Via the Trading Dave Landry’s Ultimate Bow Ties Strategy, Dave Landry also wants to assist folks who currently use Bow Ties in improving their performance by employing the fundamental method.
Add to wishlist



Reviews
There are no reviews yet.